Delta Airlines 2006 Annual Report Download - page 33
Download and view the complete annual report
Please find page 33 of the 2006 Delta Airlines annual report below. You can navigate through the pages in the report by either clicking on the pages listed below, or by using the keyword search tool below to find specific information within the annual report.-
 1
1 -
2
-
3
-
4
-
5
-
6
-
7
-
8
-
9
-
10
-
11
-
12
-
13
-
14
-
15
-
16
-
17
-
18
-
19
-
20
-
21
-
22
-
 23
23 -
 24
24 -
 25
25 -
 26
26 -
 27
27 -
 28
28 -
 29
29 -
 30
30 -
 31
31 -
 32
32 -
 33
33 -
 34
34 -
 35
35 -
 36
36 -
 37
37 -
 38
38 -
 39
39 -
 40
40 -
 41
41 -
 42
42 -
 43
43 -
44
-
45
-
46
-
47
-
48
-
49
-
50
-
51
-
52
-
53
-
54
-
55
-
56
-
57
-
58
-
59
-
60
-
61
-
62
-
63
-
64
-
65
-
66
-
67
-
68
-
69
-
70
-
71
-
72
-
73
-
74
-
75
-
76
-
77
-
78
-
79
-
80
-
81
-
82
-
83
-
84
-
85
-
86
-
87
-
88
-
89
-
90
-
91
-
92
-
93
-
94
-
95
-
96
-
97
-
98
-
99
-
100
-
101
-
102
-
103
-
104
-
105
-
106
-
107
-
108
-
109
-
110
-
111
-
112
-
113
-
114
-
115
-
116
-
117
-
118
-
119
-
120
-
121
-
122
-
123
-
124
-
125
-
126
-
127
-
128
-
129
-
130
-
131
-
132
-
133
-
134
-
135
-
136
-
137
-
138
-
139
-
140
-
141
-
142
-
143
-
144
-
145
-
146
-
147
-
148
-
149
-
150
-
151
-
152
-
153
-
154
-
155
-
156
-
157
-
158
-
159
-
160
-
161
-
162
-
163
-
164
-
165
-
166
-
167
-
168
-
169
-
170
-
171
-
172
-
173
-
174
-
175
-
176
-
177
-
178
-
179
-
180
-
181
-
182
-
183
-
184
-
185
-
186
-
187
-
188
-
189
-
190
-
191
-
192
-
193
-
194
-
195
-
196
-
197
-
198
-
199
-
200
-
201
-
202
-
203
-
204
-
205
-
206
-
207
-
208
-
209
-
210
-
211
-
212
-
213
-
214
-
215
-
216
-
217
-
218
-
219
-
220
-
221
-
222
-
223
-
224
-
225
-
226
-
227
-
228
-
229
-
230
-
231
-
232
-
233
-
234
-
235
-
236
-
237
-
238
-
239
-
240
-
241
-
242
-
243
-
244
-
245
-
246
-
247
-
248
-
249
-
250
-
251
-
252
-
253
-
254
-
255
-
256
-
257
-
258
-
259
-
260
-
261
-
262
-
263
-
264
-
265
-
266
-
267
-
268
-
269
-
270
-
271
-
272
-
273
-
274
-
275
-
276
-
277
-
278
-
279
-
280
-
281
-
282
-
283
-
284
-
285
-
286
-
287
-
288
-
289
-
290
-
291
-
292
-
293
-
294
-
295
-
296
-
297
-
298
-
299
-
300
-
301
-
302
-
303
-
304
-
305
-
306
-
307
-
308
-
309
-
310
-
311
-
312
-
313
-
314
 |
 |

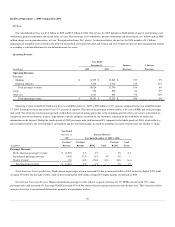
Results of Operations — 2006 Compared to 2005
Net Loss
Our consolidated net loss was $6.2 billion in 2006 and $3.8 billion in 2005. The net loss for 2006 includes (1) a $6.2 billion charge to reorganization
items, net (see “Reorganization Items, Net” below”), (2) $310 million of noncash charges associated with certain accounting adjustments (see “Accounting
Adjustments” above) and (3) a $765 million income tax benefit (see “Income Tax Benefit” below). As discussed below, the net loss for 2005 includes an $888
million charge to restructuring, asset writedowns, pension settlements and related items, net and an $884 million charge to reorganization items, net.
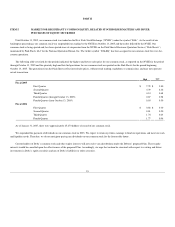
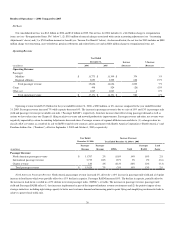
Operating Revenue
Year Ended
December 31,
Increase
(Decrease)
% Increase
(Decrease)
(in millions) 2006 2005
Operating Revenue:
Passenger:
Mainline $ 11,773 $ 11,399 $ 374 3 %
Regional affiliates 3,853 3,225 628 19 %
Total passenger revenue 15,626 14,624 1,002 7 %
Cargo 498 524 (26) (5)%
Other, net 1,047 1,043 4 0 %
Total operating revenue $ 17,171 $ 16,191 $ 980 6 %
Operating revenue totaled $17.2 billion for the year ended December 31, 2006, a $980 million, or 6%, increase compared to the year ended December
31, 2005. Passenger revenue increased 7% while capacity decreased 6%. The increase in passenger revenue is due to a rise of 10% and 13% in passenger mile
yield and passenger revenue per available seat mile (“Passenger RASM”), respectively, from fare increases that reflect strong passenger demand as well as
actions we have taken since our Chapter 11 filing to achieve revenue and network productivity improvements. Passenger revenue and other, net revenue were
negatively impacted by certain Accounting Adjustments discussed above. Passenger revenue of regional affiliates increased due to (1) a change in how we
classify ASA’s revenues as a result of its sale to SkyWest and (2) new contract carrier agreements with Shuttle America Corporation (“Shuttle America”) and
Freedom Airlines, Inc. (“Freedom”), effective September 1, 2005 and October 1, 2005, respectively.
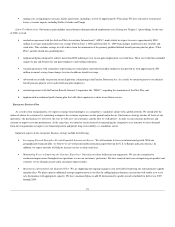
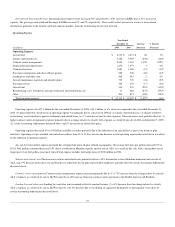
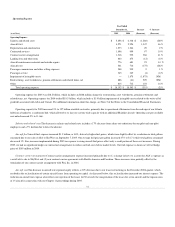
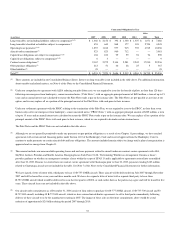
Year Ended Increase (Decrease)
December 31, 2006 Year Ended December 31, 2006 vs. 2005
Passenger Passenger Passenger Load
(in millions) Revenue Revenue RPMs Yield RASM Factor
Passenger Revenue:
North American passenger revenue $ 11,787 2% (10)% 14% 18% 2.8
International passenger revenue 3,719 24% 20 % 3% 2% (0.6)
Charter revenue 120 2% (21)% 28% 12% (5.3)
Total passenger revenue $ 15,626 7% (3)% 10% 13% 2.0
North American Passenger Revenue. North American passenger revenue increased 2%, driven by a 14% increase in passenger mile yield and a 2.8 point
increase in load factor which were partially offset by a 13% decline in capacity. Passenger RASM increased 18%. The decline in capacity, partially offset by
the increase in load factor, resulted in a 10% decline in revenue passenger miles (“RPMs”), or traffic. The increases in passenger revenue, passenger mile
yield and Passenger RASM reflect (1) fare increases implemented as part of the improved industry revenue environment and (2) the positive impact of our
strategic initiatives, including right-sizing capacity to better meet customer demand and increasing point-to-point flying and simplifying our domestic hubs to
achieve a greater local traffic mix.
26