Delta Airlines 2006 Annual Report Download - page 121
Download and view the complete annual report
Please find page 121 of the 2006 Delta Airlines annual report below. You can navigate through the pages in the report by either clicking on the pages listed below, or by using the keyword search tool below to find specific information within the annual report.-
 1
1 -
2
-
3
-
4
-
5
-
6
-
7
-
8
-
9
-
10
-
11
-
12
-
13
-
14
-
15
-
16
-
17
-
18
-
19
-
20
-
21
-
22
-
23
-
24
-
25
-
26
-
27
-
28
-
29
-
30
-
31
-
32
-
33
-
34
-
35
-
36
-
37
-
38
-
39
-
40
-
41
-
42
-
43
-
44
-
45
-
46
-
47
-
48
-
49
-
50
-
51
-
52
-
53
-
54
-
55
-
56
-
57
-
58
-
59
-
60
-
61
-
62
-
63
-
64
-
65
-
66
-
67
-
68
-
69
-
70
-
71
-
72
-
73
-
74
-
75
-
76
-
77
-
78
-
79
-
80
-
81
-
82
-
83
-
84
-
85
-
86
-
87
-
88
-
89
-
90
-
91
-
92
-
93
-
94
-
95
-
96
-
97
-
98
-
99
-
100
-
101
-
102
-
103
-
104
-
105
-
106
-
107
-
108
-
109
-
110
-
 111
111 -
 112
112 -
 113
113 -
 114
114 -
 115
115 -
 116
116 -
 117
117 -
 118
118 -
 119
119 -
 120
120 -
 121
121 -
 122
122 -
 123
123 -
 124
124 -
 125
125 -
 126
126 -
 127
127 -
 128
128 -
 129
129 -
 130
130 -
 131
131 -
132
-
133
-
134
-
135
-
136
-
137
-
138
-
139
-
140
-
141
-
142
-
143
-
144
-
145
-
146
-
147
-
148
-
149
-
150
-
151
-
152
-
153
-
154
-
155
-
156
-
157
-
158
-
159
-
160
-
161
-
162
-
163
-
164
-
165
-
166
-
167
-
168
-
169
-
170
-
171
-
172
-
173
-
174
-
175
-
176
-
177
-
178
-
179
-
180
-
181
-
182
-
183
-
184
-
185
-
186
-
187
-
188
-
189
-
190
-
191
-
192
-
193
-
194
-
195
-
196
-
197
-
198
-
199
-
200
-
201
-
202
-
203
-
204
-
205
-
206
-
207
-
208
-
209
-
210
-
211
-
212
-
213
-
214
-
215
-
216
-
217
-
218
-
219
-
220
-
221
-
222
-
223
-
224
-
225
-
226
-
227
-
228
-
229
-
230
-
231
-
232
-
233
-
234
-
235
-
236
-
237
-
238
-
239
-
240
-
241
-
242
-
243
-
244
-
245
-
246
-
247
-
248
-
249
-
250
-
251
-
252
-
253
-
254
-
255
-
256
-
257
-
258
-
259
-
260
-
261
-
262
-
263
-
264
-
265
-
266
-
267
-
268
-
269
-
270
-
271
-
272
-
273
-
274
-
275
-
276
-
277
-
278
-
279
-
280
-
281
-
282
-
283
-
284
-
285
-
286
-
287
-
288
-
289
-
290
-
291
-
292
-
293
-
294
-
295
-
296
-
297
-
298
-
299
-
300
-
301
-
302
-
303
-
304
-
305
-
306
-
307
-
308
-
309
-
310
-
311
-
312
-
313
-
314
 |
 |

NOTES TO THE CONSOLIDATED FINANCIAL STATEMENTS – (Continued)
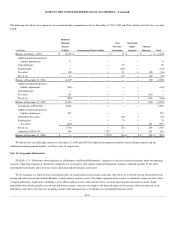
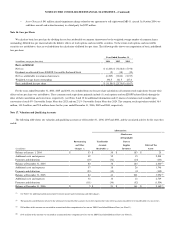
The following table shows the components of accumulated other comprehensive loss at December 31, 2006, 2005 and 2004, and the activity for the years then
ended:
(in millions)
Additional
Minimum
Pension
Liability
Unrecognized Pension Liability
Fuel
Derivative
Instruments
Marketable
Equity
Securities
Valuation
Allowance Total
Balance at January 1, 2004 $ (2,372)$ — $ 34 $ — $ — $ (2,338)
Additional minimum pension
liability adjustments
71 — — — 71
Unrealized gain — — 50 — 50
Realized gain — — (105) — (105)
Tax effect (28) — 21 — (29) (36)
Net of tax 43 — (34) — (29) (20)
Balance at December 31, 2004 (2,329) — — — (29) (2,358)
Additional minimum pension
liability adjustments
(365) — — — (365)
Unrealized gain — — — 1 1
Tax effect 141 — — — (141) —
Net of tax (224) — — 1 (141) (364)
Balance at December 31, 2005 (2,553) — — 1 (170) (2,722)
Termination of Pilot Plan 2,264 — — — 2.264
Additional minimum pension
liability adjustments
257 — — — 257
Unrealized (loss) gain — — (93) 1 (92)
Realized loss — — 70 — 70
Tax effect (958) — — — 239 (719)
Net of tax 1,563 — (23) 1 239 1,780
Adoption of SFAS 158 990 (727) — — 161 424
Balance at December 31, 2006 $ — (727)$ (23)$ 2 $ 230 $ (518)
We did not have any fuel hedge contracts at December 31, 2005 and 2004. For additional information related to our fuel hedge contracts and our
additional minimum pension liability, see Notes 4 and 10, respectively.
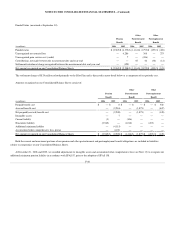
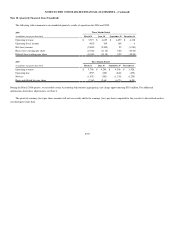
Note 14. Geographic Information
SFAS No. 131, “Disclosures about Segments of an Enterprise and Related Information”, requires us to disclose certain information about our operating
segments. Operating segments are defined as components of an enterprise with separate financial information, which is evaluated regularly by the chief
operating decision-maker and is used in resource allocation and performance assessments.
We are managed as a single business unit that provides air transportation for passengers and cargo. This allows us to benefit from an integrated revenue
pricing and route network that includes Mainline, Comair and our contract carriers. The flight equipment of the carriers is combined to form one fleet, which
is deployed through a single route scheduling system. When making resource allocation decisions, our chief operating decision maker evaluates flight
profitability data, which considers aircraft type and route economics, but gives no weight to the financial impact of the resource allocation decision on an
individual carrier basis. Our objective in making resource allocation decisions is to optimize our consolidated financial results.
F-55