Delta Airlines 2006 Annual Report Download - page 25
Download and view the complete annual report
Please find page 25 of the 2006 Delta Airlines annual report below. You can navigate through the pages in the report by either clicking on the pages listed below, or by using the keyword search tool below to find specific information within the annual report.-
 1
1 -
2
-
3
-
4
-
5
-
6
-
7
-
8
-
9
-
10
-
11
-
12
-
13
-
14
-
 15
15 -
 16
16 -
 17
17 -
 18
18 -
 19
19 -
 20
20 -
 21
21 -
 22
22 -
 23
23 -
 24
24 -
 25
25 -
 26
26 -
 27
27 -
 28
28 -
 29
29 -
 30
30 -
 31
31 -
 32
32 -
 33
33 -
 34
34 -
 35
35 -
36
-
37
-
38
-
39
-
40
-
41
-
42
-
43
-
44
-
45
-
46
-
47
-
48
-
49
-
50
-
51
-
52
-
53
-
54
-
55
-
56
-
57
-
58
-
59
-
60
-
61
-
62
-
63
-
64
-
65
-
66
-
67
-
68
-
69
-
70
-
71
-
72
-
73
-
74
-
75
-
76
-
77
-
78
-
79
-
80
-
81
-
82
-
83
-
84
-
85
-
86
-
87
-
88
-
89
-
90
-
91
-
92
-
93
-
94
-
95
-
96
-
97
-
98
-
99
-
100
-
101
-
102
-
103
-
104
-
105
-
106
-
107
-
108
-
109
-
110
-
111
-
112
-
113
-
114
-
115
-
116
-
117
-
118
-
119
-
120
-
121
-
122
-
123
-
124
-
125
-
126
-
127
-
128
-
129
-
130
-
131
-
132
-
133
-
134
-
135
-
136
-
137
-
138
-
139
-
140
-
141
-
142
-
143
-
144
-
145
-
146
-
147
-
148
-
149
-
150
-
151
-
152
-
153
-
154
-
155
-
156
-
157
-
158
-
159
-
160
-
161
-
162
-
163
-
164
-
165
-
166
-
167
-
168
-
169
-
170
-
171
-
172
-
173
-
174
-
175
-
176
-
177
-
178
-
179
-
180
-
181
-
182
-
183
-
184
-
185
-
186
-
187
-
188
-
189
-
190
-
191
-
192
-
193
-
194
-
195
-
196
-
197
-
198
-
199
-
200
-
201
-
202
-
203
-
204
-
205
-
206
-
207
-
208
-
209
-
210
-
211
-
212
-
213
-
214
-
215
-
216
-
217
-
218
-
219
-
220
-
221
-
222
-
223
-
224
-
225
-
226
-
227
-
228
-
229
-
230
-
231
-
232
-
233
-
234
-
235
-
236
-
237
-
238
-
239
-
240
-
241
-
242
-
243
-
244
-
245
-
246
-
247
-
248
-
249
-
250
-
251
-
252
-
253
-
254
-
255
-
256
-
257
-
258
-
259
-
260
-
261
-
262
-
263
-
264
-
265
-
266
-
267
-
268
-
269
-
270
-
271
-
272
-
273
-
274
-
275
-
276
-
277
-
278
-
279
-
280
-
281
-
282
-
283
-
284
-
285
-
286
-
287
-
288
-
289
-
290
-
291
-
292
-
293
-
294
-
295
-
296
-
297
-
298
-
299
-
300
-
301
-
302
-
303
-
304
-
305
-
306
-
307
-
308
-
309
-
310
-
311
-
312
-
313
-
314
 |
 |

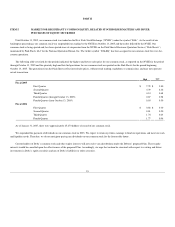
ITEM 6. SELECTED FINANCIAL DATA
Consolidated Summary of Operations(1)
For the years ended December 31,
(in millions, except share data) 2006(2) 2005 (3) 2004 (4) 2003(5) 2002 (6)
Operating revenues $ 17,171 $ 16,191 $ 15,235 $ 14,308 $ 13,866
Operating expenses 17,113 18,192 18,543 15,093 15,175
Operating income (loss) 58 (2,001) (3,308) (785) (1,309)
Interest expense, net(7) (801) (973) (787) (721) (629)
Miscellaneous income, net(8) (19) (1) 94 317 (22)
Gain (loss) on extinguishment of debt, net — — 9 — (42)
Loss before reorganization items, net (762) (2,975) (3,992) (1,189) (2,002)
Reorganization items, net (6,206) (884) — — —
Loss before income taxes (6,968) (3,859) (3,992) (1,189) (2,002)
Income tax benefit (provision) 765 41 (1,206) 416 730
Net loss (6,203) (3,818) (5,198) (773) (1,272)
Preferred stock dividends (2) (18) (19) (17) (15)
Net loss attributable to common shareowners $ (6,205) $ (3,836) $ (5,217) $ (790) $ (1,287)
Basic and diluted loss per share $ (31.58) $ (23.75) $ (41.07) $ (6.40) $ (10.44)
Dividends declared per common share $ — $ — $ — $ 0.05 $ 0.10
Other Financial and Statistical Data(1)
For the years ended December 31,
2006 (2) 2005 (3) 2004 (4) 2003(5) 2002 (6)
Total assets (millions)
$
19,622 $ 20,039 $ 21,801 $ 25,939 $ 24,720
Long-term debt and capital leases (excluding current maturities) (millions) $ 6,509 $ 6,557 $ 13,005 $ 11,538 $ 10,174
Shareowners’ (deficit) equity (millions) $ (13,593) $ (9,895) $ (5,796) $ (659) $ 893
Weighted average shares outstanding 196,496,349 161,532,291 127,033,234 123,397,129 123,292,670
Revenue passengers enplaned (thousands) 106,649 118,853 110,000 104,452 107,048
Available seat miles (millions) 147,995 156,793 151,679 139,505 145,232
Revenue passenger miles (millions) 116,133 119,954 113,311 102,301 104,422
Operating revenue per available seat mile 11.60¢ 10.33¢ 10.04¢ 10.26¢ 9.55¢
Passenger revenue per available seat mile 10.56¢ 9.33¢ 9.09¢ 9.17¢ 8.69¢
Passenger mile yield 13.46¢ 12.19¢ 12.17¢ 12.73¢ 12.26¢
Operating cost per available seat mile 11.56¢ 11.60¢ 12.23¢ 10.82¢ 10.45¢
Passenger load factor 78.5% 76.5% 74.7% 73.3% 71.9%
Breakeven passenger load factor 78.2% 87.0% 92.6% 77.8% 79.3%
Fuel gallons consumed (millions) 2,111 2,492 2,527 2,370 2,514
Average price per fuel gallon, net of
hedging activity
$ 2.04 $ 1.71 $ 1.16 $ 0.82 $ 0.67
Full-time equivalent employees, end of period 51,300 55,600 69,150 70,600 75,100
(1) Includes the operations under contract carrier agreements with unaffiliated regional air carriers:
- Chautauqua Airlines, Inc. and SkyWest Airlines, Inc. for all periods presented,
- Shuttle America Corporation for the year ended December 31, 2006 and from September 1 through December 31, 2005,
-Atlantic Southeast Airlines for the year ended December 31, 2006 and from September 8 through December 31, 2005,
-Freedom Airlines, Inc. for the year ended December 31, 2006 and from October 1, 2005 through December 31, 2005, and
-Flyi, Inc (formerly Atlantic Coast Airlines) from January 1, 2002 through November 1, 2004.
(2) Includes a $6.2 billion charge or $31.58 diluted EPS for reorganization costs; $310 million of noncash charges or $1.58 diluted EPS associated with
certain accounting adjustments; and a $765 million income tax benefit or $3.89 diluted EPS (see Item 7).