Delta Airlines 2006 Annual Report Download - page 34
Download and view the complete annual report
Please find page 34 of the 2006 Delta Airlines annual report below. You can navigate through the pages in the report by either clicking on the pages listed below, or by using the keyword search tool below to find specific information within the annual report.-
 1
1 -
2
-
3
-
4
-
5
-
6
-
7
-
8
-
9
-
10
-
11
-
12
-
13
-
14
-
15
-
16
-
17
-
18
-
19
-
20
-
21
-
22
-
23
-
 24
24 -
 25
25 -
 26
26 -
 27
27 -
 28
28 -
 29
29 -
 30
30 -
 31
31 -
 32
32 -
 33
33 -
 34
34 -
 35
35 -
 36
36 -
 37
37 -
 38
38 -
 39
39 -
 40
40 -
 41
41 -
 42
42 -
 43
43 -
 44
44 -
45
-
46
-
47
-
48
-
49
-
50
-
51
-
52
-
53
-
54
-
55
-
56
-
57
-
58
-
59
-
60
-
61
-
62
-
63
-
64
-
65
-
66
-
67
-
68
-
69
-
70
-
71
-
72
-
73
-
74
-
75
-
76
-
77
-
78
-
79
-
80
-
81
-
82
-
83
-
84
-
85
-
86
-
87
-
88
-
89
-
90
-
91
-
92
-
93
-
94
-
95
-
96
-
97
-
98
-
99
-
100
-
101
-
102
-
103
-
104
-
105
-
106
-
107
-
108
-
109
-
110
-
111
-
112
-
113
-
114
-
115
-
116
-
117
-
118
-
119
-
120
-
121
-
122
-
123
-
124
-
125
-
126
-
127
-
128
-
129
-
130
-
131
-
132
-
133
-
134
-
135
-
136
-
137
-
138
-
139
-
140
-
141
-
142
-
143
-
144
-
145
-
146
-
147
-
148
-
149
-
150
-
151
-
152
-
153
-
154
-
155
-
156
-
157
-
158
-
159
-
160
-
161
-
162
-
163
-
164
-
165
-
166
-
167
-
168
-
169
-
170
-
171
-
172
-
173
-
174
-
175
-
176
-
177
-
178
-
179
-
180
-
181
-
182
-
183
-
184
-
185
-
186
-
187
-
188
-
189
-
190
-
191
-
192
-
193
-
194
-
195
-
196
-
197
-
198
-
199
-
200
-
201
-
202
-
203
-
204
-
205
-
206
-
207
-
208
-
209
-
210
-
211
-
212
-
213
-
214
-
215
-
216
-
217
-
218
-
219
-
220
-
221
-
222
-
223
-
224
-
225
-
226
-
227
-
228
-
229
-
230
-
231
-
232
-
233
-
234
-
235
-
236
-
237
-
238
-
239
-
240
-
241
-
242
-
243
-
244
-
245
-
246
-
247
-
248
-
249
-
250
-
251
-
252
-
253
-
254
-
255
-
256
-
257
-
258
-
259
-
260
-
261
-
262
-
263
-
264
-
265
-
266
-
267
-
268
-
269
-
270
-
271
-
272
-
273
-
274
-
275
-
276
-
277
-
278
-
279
-
280
-
281
-
282
-
283
-
284
-
285
-
286
-
287
-
288
-
289
-
290
-
291
-
292
-
293
-
294
-
295
-
296
-
297
-
298
-
299
-
300
-
301
-
302
-
303
-
304
-
305
-
306
-
307
-
308
-
309
-
310
-
311
-
312
-
313
-
314
 |
 |

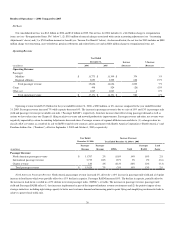
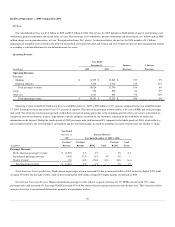
International Passenger Revenue. International passenger revenue increased 24%, generated by a 20% increase in RPMs from a 21% increase in
capacity. The passenger mile yield and Passenger RASM increased 3% and 2%, respectively. These results reflect increases in service to international
destinations, primarily in the Atlantic and Latin America markets, from the restructuring of our route network.
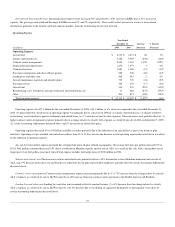
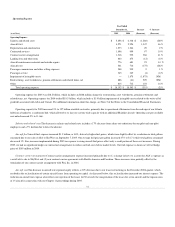
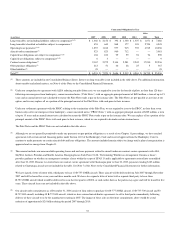
Operating Expense
Year Ended
December 31, Increase % Increase
(in millions) 2006 2005 (Decrease) (Decrease)
Operating Expense:
Aircraft fuel $ 4,319 $ 4,271 $ 48 1%
Salaries and related costs 4,128 5,058 (930) (18)%
Contract carrier arrangements 2,656 1,318 1,338 102%
Depreciation and amortization 1,276 1,273 3 0%
Contracted services 1,083 1,096 (13) (1)%
Passenger commissions and other selling expenses 888 948 (60) (6)%
Landing fees and other rents 865 863 2 0%
Aircraft maintenance materials and outside repairs 735 776 (41) (5)%
Passenger service 328 345 (17) (5)%
Aircraft rent 316 541 (225) (42)%
Restructuring, asset writedowns, pension settlements and related items, net 13 888 (875) (99)%
Other 506 815 (309) (38)%
Total operating expense $ 17,113 $ 18,192 $ (1,079) (6)%
Operating expense was $17.1 billion for the year ended December 31, 2006, a $1.1 billion, or 6%, decrease compared to the year ended December 31,
2005. As discussed below, the decrease in operating expense was primarily due to a decrease in 2006 in (1) salaries and related costs, (2) charges related to
restructuring, asset writedowns, pension settlements and related items, net, (3) aircraft rent and (4) other expenses. These decreases were partially offset by (1)
higher contract carrier arrangements expense primarily due to a change in how we classify ASA expense as a result of our sale of ASA on September 7, 2005,
(2) certain Accounting Adjustments discussed above and (3) an increase in aircraft fuel prices.
Operating capacity decreased 6% to 148 billion available seat miles primarily due to the reduction of our aircraft fleet as part of our business plan
initiatives. Operating cost per available seat mile decreased less than 1% to 11.56¢, because the decrease in total operating expense discussed above was offset
by the reduction in operating capacity.
Aircraft fuel.Aircraft fuel expense increased due to higher fuel prices despite reduced consumption. Our average fuel price per gallon increased 19% to
$2.04. Fuel gallons consumed decreased 15% due to a reduction in Mainline capacity and our sale of ASA. As a result of this sale, ASA’s fuel gallons are no
longer part of our fuel gallons consumed. Aircraft fuel expense includes fuel hedge losses of $108 million in 2006.
Salaries and related costs.The decrease in salaries and related costs primarily reflects a 12% decline due to lower Mainline headcount and our sale of
ASA, and a 9% decrease from salary rate and benefit cost reductions for our pilot and non-pilot employees, partially offset by certain Accounting Adjustments
discussed above.
Contract carrier arrangements.Contract carrier arrangements expense increased primarily due to (1) a 73% increase from the change in how we classify
ASA’s expenses as a result of its sale to SkyWest and (2) an 18% increase from new contract carrier agreements with Shuttle America and Freedom.
Landing fees and other rents.Landing fees and other rents remained relatively constant because (1) a 4% decrease from the change in how we classify
ASA’s expenses as a result of its sale to SkyWest and (2) a net 4% decrease due to our shifting of capacity from domestic to international, were offset by
certain Accounting Adjustments discussed above.
27