Delta Airlines 2006 Annual Report Download - page 120
Download and view the complete annual report
Please find page 120 of the 2006 Delta Airlines annual report below. You can navigate through the pages in the report by either clicking on the pages listed below, or by using the keyword search tool below to find specific information within the annual report.-
 1
1 -
2
-
3
-
4
-
5
-
6
-
7
-
8
-
9
-
10
-
11
-
12
-
13
-
14
-
15
-
16
-
17
-
18
-
19
-
20
-
21
-
22
-
23
-
24
-
25
-
26
-
27
-
28
-
29
-
30
-
31
-
32
-
33
-
34
-
35
-
36
-
37
-
38
-
39
-
40
-
41
-
42
-
43
-
44
-
45
-
46
-
47
-
48
-
49
-
50
-
51
-
52
-
53
-
54
-
55
-
56
-
57
-
58
-
59
-
60
-
61
-
62
-
63
-
64
-
65
-
66
-
67
-
68
-
69
-
70
-
71
-
72
-
73
-
74
-
75
-
76
-
77
-
78
-
79
-
80
-
81
-
82
-
83
-
84
-
85
-
86
-
87
-
88
-
89
-
90
-
91
-
92
-
93
-
94
-
95
-
96
-
97
-
98
-
99
-
100
-
101
-
102
-
103
-
104
-
105
-
106
-
107
-
108
-
109
-
 110
110 -
 111
111 -
 112
112 -
 113
113 -
 114
114 -
 115
115 -
 116
116 -
 117
117 -
 118
118 -
 119
119 -
 120
120 -
 121
121 -
 122
122 -
 123
123 -
 124
124 -
 125
125 -
 126
126 -
 127
127 -
 128
128 -
 129
129 -
 130
130 -
131
-
132
-
133
-
134
-
135
-
136
-
137
-
138
-
139
-
140
-
141
-
142
-
143
-
144
-
145
-
146
-
147
-
148
-
149
-
150
-
151
-
152
-
153
-
154
-
155
-
156
-
157
-
158
-
159
-
160
-
161
-
162
-
163
-
164
-
165
-
166
-
167
-
168
-
169
-
170
-
171
-
172
-
173
-
174
-
175
-
176
-
177
-
178
-
179
-
180
-
181
-
182
-
183
-
184
-
185
-
186
-
187
-
188
-
189
-
190
-
191
-
192
-
193
-
194
-
195
-
196
-
197
-
198
-
199
-
200
-
201
-
202
-
203
-
204
-
205
-
206
-
207
-
208
-
209
-
210
-
211
-
212
-
213
-
214
-
215
-
216
-
217
-
218
-
219
-
220
-
221
-
222
-
223
-
224
-
225
-
226
-
227
-
228
-
229
-
230
-
231
-
232
-
233
-
234
-
235
-
236
-
237
-
238
-
239
-
240
-
241
-
242
-
243
-
244
-
245
-
246
-
247
-
248
-
249
-
250
-
251
-
252
-
253
-
254
-
255
-
256
-
257
-
258
-
259
-
260
-
261
-
262
-
263
-
264
-
265
-
266
-
267
-
268
-
269
-
270
-
271
-
272
-
273
-
274
-
275
-
276
-
277
-
278
-
279
-
280
-
281
-
282
-
283
-
284
-
285
-
286
-
287
-
288
-
289
-
290
-
291
-
292
-
293
-
294
-
295
-
296
-
297
-
298
-
299
-
300
-
301
-
302
-
303
-
304
-
305
-
306
-
307
-
308
-
309
-
310
-
311
-
312
-
313
-
314
 |
 |

NOTES TO THE CONSOLIDATED FINANCIAL STATEMENTS – (Continued)
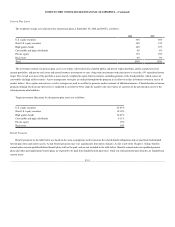
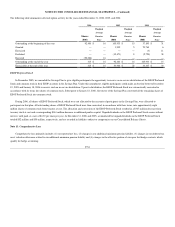
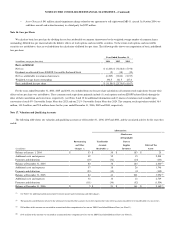
The following table summarizes all stock option activity for the years ended December 31, 2006, 2005, and 2004:
2006 2005 2004
Shares
(000)
Weighted
Average
Exercise
Price
Shares
(000)
Weighted
Average
Exercise
Price
Shares
(000)
Weighted
Average
Exercise
Price
Outstanding at the beginning of the year 92,401 $ 16 105,933 $ 15 37,893 $ 31
Granted — — 1,939 5 70,763 6
Exercised — — — — (3) 11
Forfeited — — (15,471) 8 (2,720) 38
Rejected (92,086) 16 — — — —
Outstanding at the end of the year 315 $ 16 92,401 $ 16 105,933 $ 15
Exercisable at the end of the year 315 $ 16 53,944 $ 22 33,337 $ 33
ESOP Preferred Stock
In December 2005, we amended the Savings Plan to give eligible participants the opportunity to receive an in-service distribution of the ESOP Preferred
Stock and common stock in their ESOP accounts in the Savings Plan. Under this amendment, eligible participants could make an election between December
19, 2005 and January 18, 2006 to receive such an in-service distribution. Upon its distribution, the ESOP Preferred Stock was automatically converted in
accordance with its terms into shares of common stock. Subsequent to January 18, 2006, the trustee of the Savings Plan converted all the remaining shares of
ESOP Preferred Stock into common stock.
During 2006, all shares of ESOP Preferred Stock, which were not allocated to the accounts of participants in the Savings Plan, were allocated to
participants in that plan. All outstanding shares of ESOP Preferred Stock were then converted, in accordance with their terms, into approximately eight
million shares of common stock from treasury at cost. The allocation and conversion of the ESOP Preferred Stock resulted in a $367 million decrease from
treasury stock at cost and a corresponding $144 million decrease in additional paid-in capital. Unpaid dividends on the ESOP Preferred Stock accrue without
interest, until paid, at a rate of $4.32 per share per year. At December 31, 2006 and 2005, accumulated but unpaid dividends on the ESOP Preferred Stock
totaled $52 million and $50 million, respectively, and are recorded in liabilities subject to compromise on our Consolidated Balance Sheets.
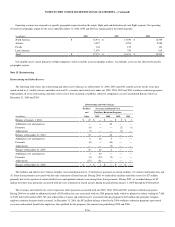
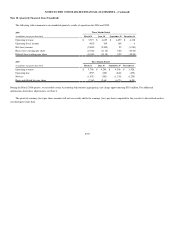
Note 13. Comprehensive Loss
Comprehensive loss primarily includes (1) our reported net loss, (2) changes in our additional minimum pension liability, (3) changes in our deferred tax
asset valuation allowance related to our additional minimum pension liability and (4) changes in the effective portion of our open fuel hedge contracts which
qualify for hedge accounting.
F-54