Delta Airlines 2006 Annual Report Download - page 37
Download and view the complete annual report
Please find page 37 of the 2006 Delta Airlines annual report below. You can navigate through the pages in the report by either clicking on the pages listed below, or by using the keyword search tool below to find specific information within the annual report.-
 1
1 -
 2
2 -
 3
3 -
 4
4 -
 5
5 -
 6
6 -
 7
7 -
 8
8 -
 9
9 -
 10
10 -
 11
11 -
 12
12 -
 13
13 -
 14
14 -
 15
15 -
 16
16 -
 17
17 -
 18
18 -
 19
19 -
 20
20 -
 21
21 -
 22
22 -
 23
23 -
 24
24 -
 25
25 -
 26
26 -
 27
27 -
 28
28 -
 29
29 -
 30
30 -
 31
31 -
 32
32 -
 33
33 -
 34
34 -
 35
35 -
 36
36 -
 37
37 -
 38
38 -
 39
39 -
 40
40 -
 41
41 -
 42
42 -
 43
43 -
 44
44 -
 45
45 -
 46
46 -
 47
47 -
 48
48 -
 49
49 -
 50
50 -
 51
51 -
 52
52 -
 53
53 -
 54
54 -
 55
55 -
 56
56 -
 57
57 -
 58
58 -
 59
59 -
 60
60 -
 61
61 -
 62
62 -
 63
63 -
 64
64 -
 65
65 -
 66
66 -
 67
67 -
 68
68 -
 69
69 -
 70
70 -
 71
71 -
 72
72 -
 73
73 -
 74
74 -
 75
75 -
 76
76 -
 77
77 -
 78
78 -
 79
79 -
 80
80 -
 81
81 -
 82
82 -
 83
83 -
 84
84 -
 85
85 -
 86
86 -
 87
87 -
 88
88 -
 89
89 -
 90
90 -
 91
91 -
 92
92 -
 93
93 -
 94
94 -
 95
95 -
 96
96 -
 97
97 -
 98
98 -
 99
99 -
 100
100 -
 101
101 -
 102
102 -
 103
103 -
 104
104 -
 105
105 -
 106
106 -
 107
107 -
 108
108 -
 109
109 -
 110
110 -
 111
111 -
 112
112 -
 113
113 -
 114
114 -
 115
115 -
 116
116 -
 117
117 -
 118
118 -
 119
119 -
 120
120 -
 121
121 -
 122
122 -
 123
123 -
 124
124 -
 125
125 -
 126
126 -
 127
127 -
 128
128 -
 129
129 -
 130
130 -
 131
131 -
 132
132 -
 133
133 -
 134
134 -
 135
135 -
 136
136 -
 137
137 -
 138
138 -
 139
139 -
 140
140 -
 141
141 -
 142
142 -
 143
143 -
 144
144 -
 145
145 -
 146
146 -
 147
147 -
 148
148 -
 149
149 -
 150
150 -
 151
151 -
 152
152 -
 153
153 -
 154
154 -
 155
155 -
 156
156 -
 157
157 -
 158
158 -
 159
159 -
 160
160 -
 161
161 -
 162
162 -
 163
163 -
 164
164 -
 165
165 -
 166
166 -
 167
167 -
 168
168 -
 169
169 -
 170
170 -
 171
171 -
 172
172 -
 173
173 -
 174
174 -
 175
175 -
 176
176 -
 177
177 -
 178
178 -
 179
179 -
 180
180 -
 181
181 -
 182
182 -
 183
183 -
 184
184 -
 185
185 -
 186
186 -
 187
187 -
 188
188 -
 189
189 -
 190
190 -
 191
191 -
 192
192 -
 193
193 -
 194
194 -
 195
195 -
 196
196 -
 197
197 -
 198
198 -
 199
199 -
 200
200 -
 201
201 -
 202
202 -
 203
203 -
 204
204 -
 205
205 -
 206
206 -
 207
207 -
 208
208 -
 209
209 -
 210
210 -
 211
211 -
 212
212 -
 213
213 -
 214
214 -
 215
215 -
 216
216 -
 217
217 -
 218
218 -
 219
219 -
 220
220 -
 221
221 -
 222
222 -
 223
223 -
 224
224 -
 225
225 -
 226
226 -
 227
227 -
 228
228 -
 229
229 -
 230
230 -
 231
231 -
 232
232 -
 233
233 -
 234
234 -
 235
235 -
 236
236 -
 237
237 -
 238
238 -
 239
239 -
 240
240 -
 241
241 -
 242
242 -
 243
243 -
 244
244 -
 245
245 -
 246
246 -
 247
247 -
 248
248 -
 249
249 -
 250
250 -
 251
251 -
 252
252 -
 253
253 -
 254
254 -
 255
255 -
 256
256 -
 257
257 -
 258
258 -
 259
259 -
 260
260 -
 261
261 -
 262
262 -
 263
263 -
 264
264 -
 265
265 -
 266
266 -
 267
267 -
 268
268 -
 269
269 -
 270
270 -
 271
271 -
 272
272 -
 273
273 -
 274
274 -
 275
275 -
 276
276 -
 277
277 -
 278
278 -
 279
279 -
 280
280 -
 281
281 -
 282
282 -
 283
283 -
 284
284 -
 285
285 -
 286
286 -
 287
287 -
 288
288 -
 289
289 -
 290
290 -
 291
291 -
 292
292 -
 293
293 -
 294
294 -
 295
295 -
 296
296 -
 297
297 -
 298
298 -
 299
299 -
 300
300 -
 301
301 -
 302
302 -
 303
303 -
 304
304 -
 305
305 -
 306
306 -
 307
307 -
 308
308 -
 309
309 -
 310
310 -
 311
311 -
 312
312 -
 313
313 -
 314
314
 |
 |

Results of Operations — 2005 Compared to 2004
Net Loss
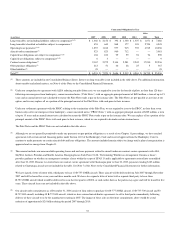
Our consolidated net loss was $3.8 billion in 2005 and $5.2 billion in 2004. The net loss for 2005 includes an $888 million charge to restructuring, asset
writedowns, pension settlements and related items, net (see “Restructuring, asset writedowns, pension settlements and related items, net” below) and an $884
million charge to reorganization items, net (see “Reorganization Items, Net” above). As discussed below, the net loss for 2004 includes a $1.9 billion
impairment of intangible assets related to the write-off of goodwill associated with ASA and Comair and a $1.2 billion income tax provision primarily related
to recording a valuation allowance for our deferred income tax assets.
Operating Revenue
Year Ended
December 31, Increase % Increase
(in millions) 2005 2004 (Decrease) (Decrease)
Operating Revenue:
Passenger:
Mainline $ 11,399 $ 10,880 $ 519 5%
Regional affiliates 3,225 2,910 315 11%
Total passenger revenue 14,624 13,790 834 6%
Cargo 524 500 24 5%
Other, net 1,043 945 98 10%
Total operating revenue $ 16,191 $ 15,235 $ 956 6%
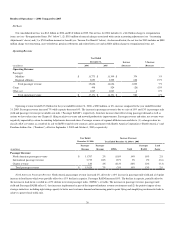
Operating revenue totaled $16.2 billion for the year ended December 31, 2005, a $956 million, or 6%, increase compared to the year ended December
31, 2004. Passenger revenue increased 6% on a 3% increase in capacity. The increase in passenger revenue reflects a 6% rise in RPMs and a flat passenger
mile yield. The relatively constant passenger mile yield reflects our lack of pricing power due to the continuing growth of low-cost carriers with which we
compete in most of our domestic markets, high industry capacity and price sensitivity by our customers, enhanced by the availability of airline fare
information on the Internet. During the fourth quarter of 2005, passenger mile yield increased 8% compared to the fourth quarter of 2004, which reflects a
general improvement in the overall business environment and the structural changes we made to strengthen our route network since our Chapter 11 filing.
Year Ended
December 31,
2005
Increase (Decrease)
Year Ended December 31, 2005 vs. 2004
Passenger Passenger Passenger Load
(in millions) Revenue Revenue RPMs Yield RASM Factor
Passenger Revenue:
North American passenger revenue $ 11,503 4 % 4 % — 3% 2.2
International passenger revenue 3,003 17 % 13 % 4% 4% —
Charter revenue 118 (2)% (25)% 30% 20% (3.6)
Total passenger revenue $ 14,624 6 % 6 % — 3% 1.8
North American Passenger Revenue. North American passenger revenue increased 4% due to increased traffic in 2005. In the first half of 2005 yields
averaged 5% below the first half of 2004, while in the second half of 2005 yields averaged 5% higher than the second half of 2004.
International Passenger Revenue. Higher international passenger revenue reflects a capacity increase of 13%. RPMs also increased 13%, while
passenger mile yield increased 4%. Passenger RASM increased 4% to 8.45¢ and load factor remained consistent with the prior year. These increases reflect
increases in service to international destinations, primarily in transatlantic markets.
30
