Delta Airlines 2006 Annual Report Download - page 124
Download and view the complete annual report
Please find page 124 of the 2006 Delta Airlines annual report below. You can navigate through the pages in the report by either clicking on the pages listed below, or by using the keyword search tool below to find specific information within the annual report.-
 1
1 -
2
-
3
-
4
-
5
-
6
-
7
-
8
-
9
-
10
-
11
-
12
-
13
-
14
-
15
-
16
-
17
-
18
-
19
-
20
-
21
-
22
-
23
-
24
-
25
-
26
-
27
-
28
-
29
-
30
-
31
-
32
-
33
-
34
-
35
-
36
-
37
-
38
-
39
-
40
-
41
-
42
-
43
-
44
-
45
-
46
-
47
-
48
-
49
-
50
-
51
-
52
-
53
-
54
-
55
-
56
-
57
-
58
-
59
-
60
-
61
-
62
-
63
-
64
-
65
-
66
-
67
-
68
-
69
-
70
-
71
-
72
-
73
-
74
-
75
-
76
-
77
-
78
-
79
-
80
-
81
-
82
-
83
-
84
-
85
-
86
-
87
-
88
-
89
-
90
-
91
-
92
-
93
-
94
-
95
-
96
-
97
-
98
-
99
-
100
-
101
-
102
-
103
-
104
-
105
-
106
-
107
-
108
-
109
-
110
-
111
-
112
-
113
-
 114
114 -
 115
115 -
 116
116 -
 117
117 -
 118
118 -
 119
119 -
 120
120 -
 121
121 -
 122
122 -
 123
123 -
 124
124 -
 125
125 -
 126
126 -
 127
127 -
 128
128 -
 129
129 -
 130
130 -
 131
131 -
 132
132 -
 133
133 -
 134
134 -
135
-
136
-
137
-
138
-
139
-
140
-
141
-
142
-
143
-
144
-
145
-
146
-
147
-
148
-
149
-
150
-
151
-
152
-
153
-
154
-
155
-
156
-
157
-
158
-
159
-
160
-
161
-
162
-
163
-
164
-
165
-
166
-
167
-
168
-
169
-
170
-
171
-
172
-
173
-
174
-
175
-
176
-
177
-
178
-
179
-
180
-
181
-
182
-
183
-
184
-
185
-
186
-
187
-
188
-
189
-
190
-
191
-
192
-
193
-
194
-
195
-
196
-
197
-
198
-
199
-
200
-
201
-
202
-
203
-
204
-
205
-
206
-
207
-
208
-
209
-
210
-
211
-
212
-
213
-
214
-
215
-
216
-
217
-
218
-
219
-
220
-
221
-
222
-
223
-
224
-
225
-
226
-
227
-
228
-
229
-
230
-
231
-
232
-
233
-
234
-
235
-
236
-
237
-
238
-
239
-
240
-
241
-
242
-
243
-
244
-
245
-
246
-
247
-
248
-
249
-
250
-
251
-
252
-
253
-
254
-
255
-
256
-
257
-
258
-
259
-
260
-
261
-
262
-
263
-
264
-
265
-
266
-
267
-
268
-
269
-
270
-
271
-
272
-
273
-
274
-
275
-
276
-
277
-
278
-
279
-
280
-
281
-
282
-
283
-
284
-
285
-
286
-
287
-
288
-
289
-
290
-
291
-
292
-
293
-
294
-
295
-
296
-
297
-
298
-
299
-
300
-
301
-
302
-
303
-
304
-
305
-
306
-
307
-
308
-
309
-
310
-
311
-
312
-
313
-
314
 |
 |

NOTES TO THE CONSOLIDATED FINANCIAL STATEMENTS – (Continued)
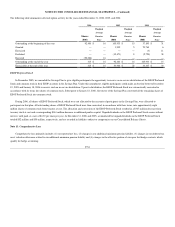
•Asset Charges.A $41 million aircraft impairment charge related to our agreement to sell eight owned MD-11 aircraft. In October 2004, we
sold these aircraft and related inventory to a third party for $227 million.
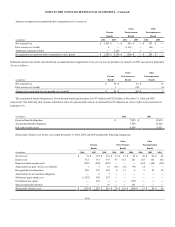
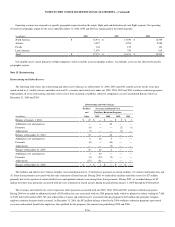
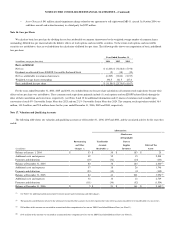
Note 16. Loss per Share
We calculate basic loss per share by dividing the net loss attributable to common shareowners by the weighted average number of common shares
outstanding. Diluted loss per share includes the dilutive effects of stock options and convertible securities. To the extent stock options and convertible
securities are anti-dilutive, they are excluded from the calculation of diluted loss per share. The following table shows our computation of basic and diluted
loss per share:
Years Ended December 31,
(in millions, except per share data) 2006 2005 2004
Basic and diluted:
Net loss $ (6,203) $ (3,818) $ (5,198)
Dividends on allocated Series B ESOP Convertible Preferred Stock (2) (18) (19)
Net loss attributable to common shareowners (6,205) (3,836) (5,217)
Weighted average shares outstanding 196.5 161.5 127.0
Basic and diluted loss per share $ (31.58) $ (23.75) $ (41.07)
For the years ended December 31, 2006, 2005 and 2004, we excluded from our loss per share calculations all common stock equivalents because their
effect on loss per share was anti-dilutive. These common stock equivalents primarily include (1) stock options and our ESOP Preferred Stock through the
dates of their cancellation and conversion, respectively, (see Notes 2 and 12 for additional information) and (2) shares of common stock issuable upon
conversion of our 8.0% Convertible Senior Notes due 2023 and our 27/8% Convertible Senior Notes due 2024. The common stock equivalents totaled 36.4
million, 143.2 million, and 78.8 million shares for the years ended December 31, 2006, 2005 and 2004, respectively.
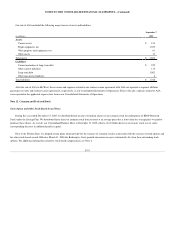
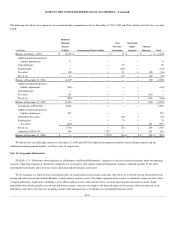
Note 17. Valuation and Qualifying Accounts
The following table shows our valuation and qualifying accounts as of December 31, 2006, 2005 and 2004, and the associated activity for the years then
ended:
Allowance for:
(in millions)
Restructuring
and Other
Charges (1)
Uncollectible
Accounts
Receivable (2)
Obsolescence
of Expendable
Parts &
Supplies
Inventory
Deferred Tax
Assets
Balance at January 1, 2004 $ 53 $ 38 $ 183 $ 25
Additional costs and expenses 42 32 15 2,508
Payments and deductions (15) (32) (14) (133)
Balance at December 31, 2004 80 38 184 2,400(3)
Additional costs and expenses 57 18 26 1,746
Payments and deductions (53) (15) (9) (192)
Balance at December 31, 2005 84 41 201 3,954(4)
Additional costs and expenses 32 16 12 2,749
Payments and deductions (111) (36) (52) (1,534)
Balance at December 31, 2006 $ 5 $ 21 $ 161 $ 5,169(5)
(1) See Note 7 for additional information related to leased aircraft and restructuring and other charges.
(2) The payments and deductions related to the allowance for uncollectible accounts receivable represent the write-off of accounts considered to be uncollectible, less recoveries.
(3) $29 million of this amount was recorded in accumulated other comprehensive loss on our 2004 Consolidated Balance Sheet (see Note 13).
(4) $141 million of this amount was recorded in accumulated other comprehensive loss on our 2005 Consolidated Balance Sheet (see Note 13).