Delta Airlines 2006 Annual Report Download - page 49
Download and view the complete annual report
Please find page 49 of the 2006 Delta Airlines annual report below. You can navigate through the pages in the report by either clicking on the pages listed below, or by using the keyword search tool below to find specific information within the annual report.-
 1
1 -
2
-
3
-
4
-
5
-
6
-
7
-
8
-
9
-
10
-
11
-
12
-
13
-
14
-
15
-
16
-
17
-
18
-
19
-
20
-
21
-
22
-
23
-
24
-
25
-
26
-
27
-
28
-
29
-
30
-
31
-
32
-
33
-
34
-
35
-
36
-
37
-
38
-
 39
39 -
 40
40 -
 41
41 -
 42
42 -
 43
43 -
 44
44 -
 45
45 -
 46
46 -
 47
47 -
 48
48 -
 49
49 -
 50
50 -
 51
51 -
 52
52 -
 53
53 -
 54
54 -
 55
55 -
 56
56 -
 57
57 -
 58
58 -
 59
59 -
60
-
61
-
62
-
63
-
64
-
65
-
66
-
67
-
68
-
69
-
70
-
71
-
72
-
73
-
74
-
75
-
76
-
77
-
78
-
79
-
80
-
81
-
82
-
83
-
84
-
85
-
86
-
87
-
88
-
89
-
90
-
91
-
92
-
93
-
94
-
95
-
96
-
97
-
98
-
99
-
100
-
101
-
102
-
103
-
104
-
105
-
106
-
107
-
108
-
109
-
110
-
111
-
112
-
113
-
114
-
115
-
116
-
117
-
118
-
119
-
120
-
121
-
122
-
123
-
124
-
125
-
126
-
127
-
128
-
129
-
130
-
131
-
132
-
133
-
134
-
135
-
136
-
137
-
138
-
139
-
140
-
141
-
142
-
143
-
144
-
145
-
146
-
147
-
148
-
149
-
150
-
151
-
152
-
153
-
154
-
155
-
156
-
157
-
158
-
159
-
160
-
161
-
162
-
163
-
164
-
165
-
166
-
167
-
168
-
169
-
170
-
171
-
172
-
173
-
174
-
175
-
176
-
177
-
178
-
179
-
180
-
181
-
182
-
183
-
184
-
185
-
186
-
187
-
188
-
189
-
190
-
191
-
192
-
193
-
194
-
195
-
196
-
197
-
198
-
199
-
200
-
201
-
202
-
203
-
204
-
205
-
206
-
207
-
208
-
209
-
210
-
211
-
212
-
213
-
214
-
215
-
216
-
217
-
218
-
219
-
220
-
221
-
222
-
223
-
224
-
225
-
226
-
227
-
228
-
229
-
230
-
231
-
232
-
233
-
234
-
235
-
236
-
237
-
238
-
239
-
240
-
241
-
242
-
243
-
244
-
245
-
246
-
247
-
248
-
249
-
250
-
251
-
252
-
253
-
254
-
255
-
256
-
257
-
258
-
259
-
260
-
261
-
262
-
263
-
264
-
265
-
266
-
267
-
268
-
269
-
270
-
271
-
272
-
273
-
274
-
275
-
276
-
277
-
278
-
279
-
280
-
281
-
282
-
283
-
284
-
285
-
286
-
287
-
288
-
289
-
290
-
291
-
292
-
293
-
294
-
295
-
296
-
297
-
298
-
299
-
300
-
301
-
302
-
303
-
304
-
305
-
306
-
307
-
308
-
309
-
310
-
311
-
312
-
313
-
314
 |
 |

As of December 31, 2006, we had hedged 36% of our projected fuel requirements for the March 2007 quarter using heating oil and jet fuel zero-cost
collar contracts with a weighted average contract cap and floor price of $1.93 and $1.82, respectively. We recognized a $17 million loss from the settlement of
certain of these contracts at January 31, 2007. During January 2007, we hedged approximately 24% of our projected fuel requirements for the nine months
ending September 30, 2007 using heating oil and jet fuel zero-cost collar and swap contracts. The swap contracts have a weighted average contract price of
$1.58 and the zero-cost collar contracts have a weighted average contract cap and floor price of $1.83 and $1.67, respectively. As of January 31, 2007, our
open fuel hedge contracts had an estimated fair market value gain of $2 million. We have not entered into any hedges for the December 2007 quarter. We
estimate that a 10% rise in the price per gallon of heating oil and jet fuel would change the estimated fair market value associated with our outstanding
contracts at settlement to a $41 million gain.
We project that our aircraft fuel consumption will be 2.6 billion gallons in 2007. Based on a projected average jet fuel price of $2.00 per gallon for 2007,
a 10% rise in jet fuel prices would increase our aircraft fuel expense by $487 million, inclusive of the impact of effective hedge instruments that have settled
or are outstanding as of January 31, 2007.
We did not have any fuel hedge contracts outstanding as of December 31, 2005.
For additional information regarding derivative contracts and other exposures to market risks, see Note 4 of the Notes to the Consolidated Financial
Statements.
Interest Rate Risk
Our exposure to market risk from volatility in interest rates is primarily associated with our long-term debt obligations. Market risk associated with our
fixed and variable rate long-term debt relates to the potential reduction in fair value and negative impact to future earnings, respectively, from an increase in
interest rates. The following sensitivity analysis for long-term debt at December 31, 2006 and 2005 excludes long-term debt subject to compromise due to our
status as a debtor-in-possession under Chapter 11. At December 31, 2006 and 2005, a 10% increase in average annual interest rates would have decreased the
estimated fair value of our long-term debt not subject to compromise by $114 million and $78 million, respectively, and increase interest expense by $24
million and $19 million, respectively. At December 31, 2006 and 2005, we did not have any interest rate swaps or contractual arrangements that would reduce
our interest expense. For additional information on our long-term debt agreements, see Note 6 of the Notes to the Consolidated Financial Statements.
While operating as a debtor-in-possession, in accordance with SOP 90-7, we record interest expense only to the extent (1) interest will be paid during our
Chapter 11 proceeding or (2) it is probable interest will be an allowed priority, secured, or unsecured claim. Interest expense recorded on our Consolidated
Statements of Operations totaled $870 million for 2006. Contractual interest expense (including interest expense that is associated with obligations classified
as liabilities subject to compromise) totaled $1.2 billion for 2006.
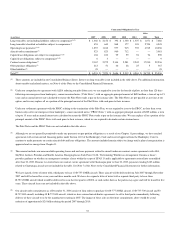
Glossary of Defined Terms
ASM— Available Seat Mile. A measure of capacity. ASMs equal the total number of seats available for transporting passengers during a reporting
period multiplied by the total number of miles flown during that period.
Cargo Ton Miles— The total number of tons of cargo transported during a reporting period, multiplied by the total number of miles cargo is flown
during that period.
Cargo Ton Mile Yield— The amount of cargo revenue earned per cargo ton mile during a reporting period.
CASM— (Operating) Cost per Available Seat Mile. The amount of operating cost incurred per ASM during a reporting period, also referred to as “unit
cost”.
Passenger Load Factor— A measure of utilized available seating capacity calculated by dividing RPMs by ASMs for a reporting period.
Passenger Mile Yield— The amount of passenger revenue earned per RPM during a reporting period.
42