Delta Airlines 2005 Annual Report Download - page 41
Download and view the complete annual report
Please find page 41 of the 2005 Delta Airlines annual report below. You can navigate through the pages in the report by either clicking on the pages listed below, or by using the keyword search tool below to find specific information within the annual report.-
 1
1 -
2
-
3
-
4
-
5
-
6
-
7
-
8
-
9
-
10
-
11
-
12
-
13
-
14
-
15
-
16
-
17
-
18
-
19
-
20
-
21
-
22
-
23
-
24
-
25
-
26
-
27
-
28
-
29
-
30
-
 31
31 -
 32
32 -
 33
33 -
 34
34 -
 35
35 -
 36
36 -
 37
37 -
 38
38 -
 39
39 -
 40
40 -
 41
41 -
 42
42 -
 43
43 -
 44
44 -
 45
45 -
 46
46 -
 47
47 -
 48
48 -
 49
49 -
 50
50 -
 51
51 -
52
-
53
-
54
-
55
-
56
-
57
-
58
-
59
-
60
-
61
-
62
-
63
-
64
-
65
-
66
-
67
-
68
-
69
-
70
-
71
-
72
-
73
-
74
-
75
-
76
-
77
-
78
-
79
-
80
-
81
-
82
-
83
-
84
-
85
-
86
-
87
-
88
-
89
-
90
-
91
-
92
-
93
-
94
-
95
-
96
-
97
-
98
-
99
-
100
-
101
-
102
-
103
-
104
-
105
-
106
-
107
-
108
-
109
-
110
-
111
-
112
-
113
-
114
-
115
-
116
-
117
-
118
-
119
-
120
-
121
-
122
-
123
-
124
-
125
-
126
-
127
-
128
-
129
-
130
-
131
-
132
-
133
-
134
-
135
-
136
-
137
-
138
-
139
-
140
-
141
-
142
 |
 |

Table of Contents
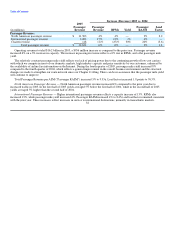
North American Passenger Revenues. North American passenger revenues increased 4% to $11.1 billion for 2004 on a capacity
increase of 7%. RPMs increased 9%, while passenger mile yield fell 4%. Passenger RASM decreased 3% to 9.28¢. Load factor
increased by 1.1 points to 73.7%.
International Passenger Revenues. International passenger revenues increased 18% to $2.6 billion during 2004 on a capacity
increase of 15%. RPMs increased 19%, while passenger mile yield remained unchanged. Passenger RASM increased 3% to 8.16¢, and
load factor rose 2.2 points to 78.9%. All of these increases are primarily due to the depressed levels in the prior year from the war in
Iraq.
Cargo and Other Revenues. Cargo revenues increased 7% to $500 million in 2004 primarily due to a 13% increase from higher
international freight volume and yield, which was partially offset by a 5% decrease due to lower mail volume and yield. Cargo ton
miles increased 6%, while cargo ton mile yield remained relatively flat. Other revenues increased 15% to $945 million, primarily
reflecting a 6% increase due to revenue from new airport handling contracts and other miscellaneous contracts, a 5% rise due to
increased administrative service charges, and a 3% increase due to higher codeshare revenue from capacity increases.
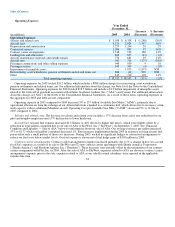
Operating Expense
Operating expenses were $18.5 billion for 2004, a 23%, or $3.5 billion, increase over 2003. As discussed below, the increase in
operating expenses was primarily due to (1) a $1.9 billion goodwill impairment charge recorded in 2004; (2) significantly higher fuel
prices in 2004 than in 2003; and (3) $398 million in reimbursements we received under the Emergency Wartime Supplemental
Appropriations Act ("Appropriations Act") in 2003 which were recorded as an offset to operating expenses in that year. Operating
capacity increased 9% to 152 billion ASMs primarily due to the restoration of capacity that we reduced in 2003 due to the war in Iraq.
CASM increased 13% to 12.23¢.
Salaries and related costs were relatively flat at $6.3 billion. This reflects a 3% decline due to a decrease in benefit expenses from
our cost savings initiatives and a 2% decline due to lower Mainline headcount. These decreases were offset by (1) a 3% increase due
to higher pension and related expense; (2) a 1% increase due to a 4.5% salary rate increase in May 2004 for our pilots under their
collective bargaining agreement which was partially offset by their rate decrease effective December 1, 2004; and (3) a 1% increase
due to growth in operations.
Aircraft fuel expense increased 51%, or $986 million, to $2.9 billion, with approximately $820 million of the increase resulting
from higher fuel prices. The average fuel price per gallon increased 42% to $1.16, and total gallons consumed increased 7%.
Approximately 8% and 65% of our aircraft fuel requirements were hedged during 2004 and 2003, respectively. As discussed in Note 6
of the Notes to the Consolidated Financial Statements, in February 2004, we settled all of our fuel hedge contracts prior to their
scheduled settlement dates, resulting in a deferred gain of $82 million that we recognized during 2004. In 2004, our fuel expense is
shown net of fuel hedge gains of $105 million, which included the gain related to the early settlement. Our fuel expense for 2003 is
shown net of fuel hedge gains of $152 million.
Contracted services expense increased 13%, primarily reflecting a 4% increase from new contracts to provide airport handling and
other miscellaneous services, a 2% increase due to technology projects, a 2% increase due to the suspension of the Transportation
Security Administration ("TSA") security fee from June 1, 2003 to September 30, 2003 and subsequent reimbursements and a 2%
increase resulting from higher capacity.
Expenses from our contract carrier arrangements increased 19% to $932 million, largely reflecting an 8% increase from higher
fuel costs, a 7% increase due to growth under certain contract carrier arrangements and a 3% increase from higher maintenance
expense.
Aircraft maintenance materials and outside repairs increased 8%, primarily due to increased materials volume and higher costs
from scheduled maintenance events. Other selling expenses increased 5%, primarily reflecting a 3% rise from increased credit card
charges due to higher traffic and a 1% increase from advertising and promotions. Passenger service expense increased 7%, primarily
due to increased traffic.
During December 2004, we recorded a $1.9 billion impairment charge, primarily related to goodwill, in accordance with
Statement of Financial Accounting Standards ("SFAS") No. 142, "Goodwill and Other
36