Delta Airlines 2005 Annual Report Download - page 37
Download and view the complete annual report
Please find page 37 of the 2005 Delta Airlines annual report below. You can navigate through the pages in the report by either clicking on the pages listed below, or by using the keyword search tool below to find specific information within the annual report.-
 1
1 -
2
-
3
-
4
-
5
-
6
-
7
-
8
-
9
-
10
-
11
-
12
-
13
-
14
-
15
-
16
-
17
-
18
-
19
-
20
-
21
-
22
-
23
-
24
-
25
-
26
-
 27
27 -
 28
28 -
 29
29 -
 30
30 -
 31
31 -
 32
32 -
 33
33 -
 34
34 -
 35
35 -
 36
36 -
 37
37 -
 38
38 -
 39
39 -
 40
40 -
 41
41 -
 42
42 -
 43
43 -
 44
44 -
 45
45 -
 46
46 -
 47
47 -
48
-
49
-
50
-
51
-
52
-
53
-
54
-
55
-
56
-
57
-
58
-
59
-
60
-
61
-
62
-
63
-
64
-
65
-
66
-
67
-
68
-
69
-
70
-
71
-
72
-
73
-
74
-
75
-
76
-
77
-
78
-
79
-
80
-
81
-
82
-
83
-
84
-
85
-
86
-
87
-
88
-
89
-
90
-
91
-
92
-
93
-
94
-
95
-
96
-
97
-
98
-
99
-
100
-
101
-
102
-
103
-
104
-
105
-
106
-
107
-
108
-
109
-
110
-
111
-
112
-
113
-
114
-
115
-
116
-
117
-
118
-
119
-
120
-
121
-
122
-
123
-
124
-
125
-
126
-
127
-
128
-
129
-
130
-
131
-
132
-
133
-
134
-
135
-
136
-
137
-
138
-
139
-
140
-
141
-
142
 |
 |

Table of Contents
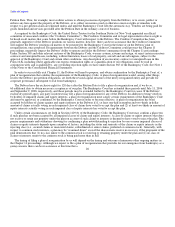
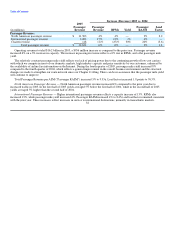
Increase (Decrease) 2005 vs. 2004
2005
Passenger Passenger Passenger Load
(in millions) Revenue Revenue RPMs Yield RASM Factor
Passenger Revenue:
North American passenger revenue $ 11,503 4% 4% — 3% 2.2
International passenger revenue 3,003 17% 13% 4% 4% —
Charter revenue 118 (2)% (25)% 30% 20% (3.6)
Total passenger revenue $ 14,624 6% 6% — 3% 1.8
Operating revenues totaled $16.2 billion in 2005, a $956 million increase as compared to the prior year. Passenger revenue
increased 6% on a 3% increase in capacity. The increase in passenger revenue reflects a 6% rise in RPMs, and a flat passenger mile
yield.
The relatively constant passenger mile yield reflects our lack of pricing power due to the continuing growth of low-cost carriers
with which we compete in most of our domestic markets, high industry capacity and price sensitivity by our customers, enhanced by
the availability of airline fare information on the Internet. During the fourth quarter of 2005, passenger mile yield increased 8%
compared to the fourth quarter of 2004, which reflects a general improvement in the overall business environment and the structural
changes we made to strengthen our route network since our Chapter 11 filing. There can be no assurance that the passenger mile yield
will continue to improve.
Total Passenger Revenue per ASM ("Passenger RASM") increased 3% to 9.33¢. Load factor increased 1.8 points to 76.5%.
North American Passenger Revenue — North American passenger revenue increased 4% compared to the prior year due to
increased traffic in 2005. In the first half of 2005 yields averaged 5% below the first half of 2004, while in the second half of 2005
yields averaged 5% higher than the second half of 2004.
International Passenger Revenue — Higher international passenger revenue reflects a capacity increase of 13%. RPMs also
increased 13%, while passenger mile yield increased 4%. Passenger RASM increased 4% to 8.45¢ and load factor remained consistent
with the prior year. These increases reflect increases in service to international destinations, primarily in transatlantic markets.
32