Delta Airlines 2005 Annual Report Download - page 109
Download and view the complete annual report
Please find page 109 of the 2005 Delta Airlines annual report below. You can navigate through the pages in the report by either clicking on the pages listed below, or by using the keyword search tool below to find specific information within the annual report.-
 1
1 -
2
-
3
-
4
-
5
-
6
-
7
-
8
-
9
-
10
-
11
-
12
-
13
-
14
-
15
-
16
-
17
-
18
-
19
-
20
-
21
-
22
-
23
-
24
-
25
-
26
-
27
-
28
-
29
-
30
-
31
-
32
-
33
-
34
-
35
-
36
-
37
-
38
-
39
-
40
-
41
-
42
-
43
-
44
-
45
-
46
-
47
-
48
-
49
-
50
-
51
-
52
-
53
-
54
-
55
-
56
-
57
-
58
-
59
-
60
-
61
-
62
-
63
-
64
-
65
-
66
-
67
-
68
-
69
-
70
-
71
-
72
-
73
-
74
-
75
-
76
-
77
-
78
-
79
-
80
-
81
-
82
-
83
-
84
-
85
-
86
-
87
-
88
-
89
-
90
-
91
-
92
-
93
-
94
-
95
-
96
-
97
-
98
-
 99
99 -
 100
100 -
 101
101 -
 102
102 -
 103
103 -
 104
104 -
 105
105 -
 106
106 -
 107
107 -
 108
108 -
 109
109 -
 110
110 -
 111
111 -
 112
112 -
 113
113 -
 114
114 -
 115
115 -
 116
116 -
 117
117 -
 118
118 -
 119
119 -
120
-
121
-
122
-
123
-
124
-
125
-
126
-
127
-
128
-
129
-
130
-
131
-
132
-
133
-
134
-
135
-
136
-
137
-
138
-
139
-
140
-
141
-
142
 |
 |
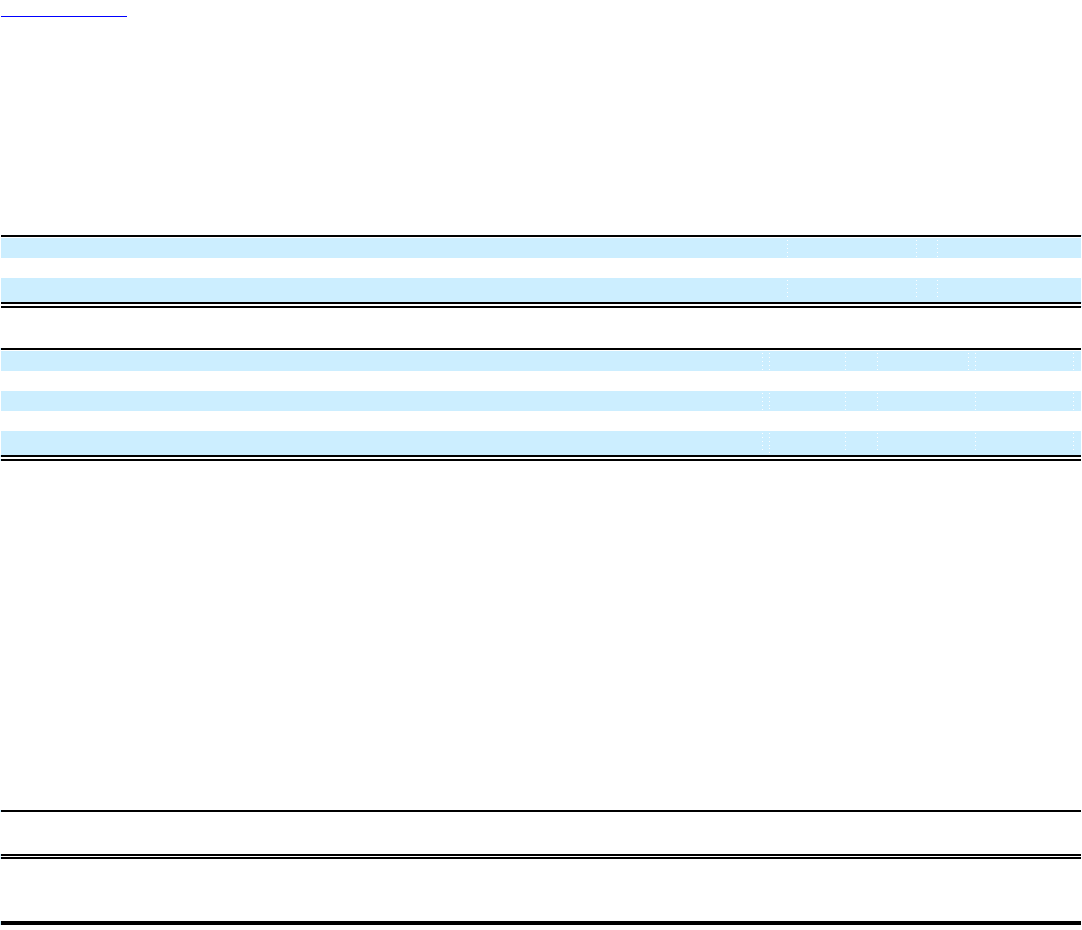
Table of Contents
NOTES TO THE CONSOLIDATED FINANCIAL STATEMENTS — (Continued)
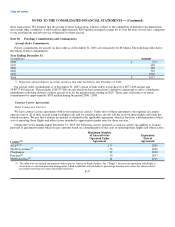
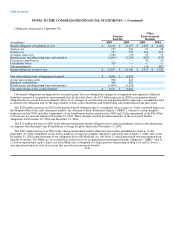
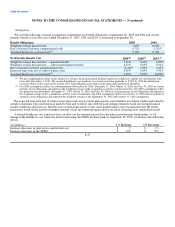
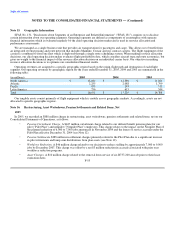
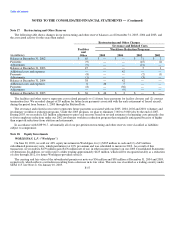
Assumptions
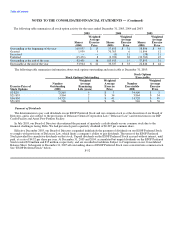
We used the following actuarial assumptions to determine our benefit obligations at September 30, 2005 and 2004 and our net
periodic benefit cost for the years ended December 31, 2005, 2004 and 2003, as measured at September 30:
Benefit Obligations 2005 2004
Weighted average discount rate 5.69% 6.00%
Rate of increase in future compensation levels 0.72% (1.28)%
Assumed healthcare cost trend rate(1) 9.50% 9.50%
Net Periodic Benefit Cost 2005(2) 2004(2) 2003(2)
Weighted average discount rate — pension benefits 5.81% 6.09% 6.83%
Weighted average discount rate — other postretirement benefits 6.10% 6.05% 6.91%
Rate of increase in future compensation levels (1.28)% 1.89% 2.47%
Expected long-term rate of return on plan assets 9.00% 9.00% 9.00%
Assumed healthcare cost trend rate(1) 9.50% 9.00% 10.00%
(1) We have implemented a limit on the amount we will pay for postretirement medical benefits for employees eligible for such benefits who
retire after November 1, 1993. The assumed healthcare cost trend rate is assumed to decline gradually to 5.00% by 2010 for health plan
costs not subject to this limit and to zero by 2007 for health plan costs subject to the limit and remain level thereafter.
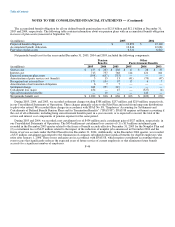
(2) Our 2005 assumptions reflect our remeasurements (November 30, 2004, December 31, 2004, March 31, 2005, and June 30, 2005) of certain
portions of our obligations and represent the weighted average of the assumptions used for each measurement. Our 2004 assumptions reflect
our quarterly remeasurements (December 31, 2003, March 31, 2004, and June 30, 2004) of certain portions of our obligations and represent
the weighted average of the assumptions used for each measurement. Our 2003 assumptions reflect our October 31, 2002 remeasurement of
a portion of our obligations and represent the weighted average of the September 30, 2002 and October 31, 2002 assumptions.
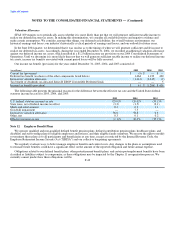
The expected long-term rate of return on our plan assets was based on plan-specific asset/ liability investment studies performed by
outside consultants who used historical market return and volatility data with forward looking estimates based on existing financial
market conditions and forecasts. Modest excess return expectations versus some market indices were incorporated into the return
projections based on the actively managed structure of our investment program and its record of achieving such returns historically.
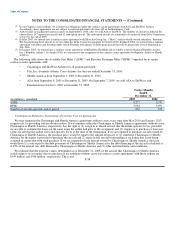
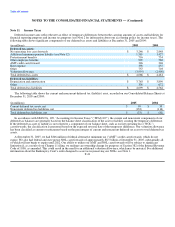
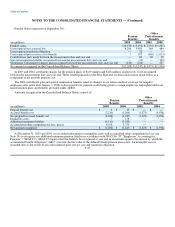
Assumed healthcare cost trend rates have an effect on the amounts reported for the other postretirement benefit plans. A 1%
change in the healthcare cost trend rate used in measuring the APBO for these plans at September 30, 2005, would have the following
effects:
(in millions) 1% Increase 1% Decrease
Increase (decrease) in total service and interest cost $ 9 $ (7)
Increase (decrease) in the APBO $ 109 $ (93)
F-47