DIRECTV 2008 Annual Report Download - page 70
Download and view the complete annual report
Please find page 70 of the 2008 DIRECTV annual report below. You can navigate through the pages in the report by either clicking on the pages listed below, or by using the keyword search tool below to find specific information within the annual report.-
 1
1 -
2
-
3
-
4
-
5
-
6
-
7
-
8
-
9
-
10
-
11
-
12
-
13
-
14
-
15
-
16
-
17
-
18
-
19
-
20
-
21
-
22
-
23
-
24
-
25
-
26
-
27
-
28
-
29
-
30
-
31
-
32
-
33
-
34
-
35
-
36
-
37
-
38
-
39
-
40
-
41
-
42
-
43
-
44
-
45
-
46
-
47
-
48
-
49
-
50
-
51
-
52
-
53
-
54
-
55
-
56
-
57
-
58
-
59
-
 60
60 -
 61
61 -
 62
62 -
 63
63 -
 64
64 -
 65
65 -
 66
66 -
 67
67 -
 68
68 -
 69
69 -
 70
70 -
 71
71 -
 72
72 -
 73
73 -
 74
74 -
 75
75 -
 76
76 -
 77
77 -
 78
78 -
 79
79 -
 80
80 -
81
-
82
-
83
-
84
-
85
-
86
-
87
-
88
-
89
-
90
-
91
-
92
-
93
-
94
-
95
-
96
-
97
-
98
-
99
-
100
-
101
-
102
-
103
-
104
-
105
-
106
-
107
-
108
-
109
-
110
-
111
-
112
-
113
-
114
-
115
-
116
-
117
-
118
-
119
-
120
-
121
-
122
-
123
-
124
-
125
-
126
-
127
-
128
-
129
-
130
-
131
-
132
-
133
-
134
-
135
-
136
-
137
-
138
-
139
-
140
-
141
-
142
 |
 |

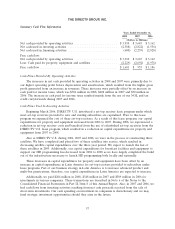
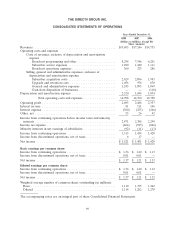
THE DIRECTV GROUP, INC.
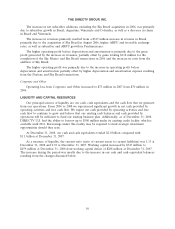
Summary Cash Flow Information
Years Ended December 31,
2008 2007 2006
(Dollars in Millions)
Net cash provided by operating activities ........................ $3,910 $ 3,645 $ 3,162
Net cash used in investing activities ............................ (2,388) (2,822) (1,536)
Net cash used in financing activities ............................ (600) (2,239) (2,828)
Free cash flow:
Net cash provided by operating activities ........................ $3,910 $ 3,645 $ 3,162
Less: Cash paid for property, equipment and satellites ............... (2,229) (2,692) (1,976)
Free cash flow ............................................ $1,681 $ 953 $ 1,186
Cash Flows Provided By Operating Activities
The increases in net cash provided by operating activities in 2008 and 2007 were primarily due to
our higher operating profit before depreciation and amortization, which resulted from the higher gross
profit generated from an increase in revenues. These increases were partially offset by an increase in
cash paid for income taxes, which was $706 million in 2008, $408 million in 2007 and $30 million in
2006. The increase in cash paid for income taxes resulted mainly from the use of our NOL and tax
credit carryforwards during 2007 and 2006.
Cash Flows Used In Investing Activities
Beginning March 2006, DIRECTV U.S. introduced a set-top receiver lease program under which
most set-top receivers provided to new and existing subscribers are capitalized. Prior to this lease
program we expensed the cost of these set-top receivers. As a result of this lease program, our capital
expenditures for property and equipment increased from 2006 to 2007. During 2008, we experienced a
reduction in set-top receiver costs and benefited from the use of refurbished set-top receivers from the
DIRECTV U.S. lease program, which resulted in a reduction in capital expenditures for property and
equipment from 2007 to 2008.
Also at DIRECTV U.S. during 2006, 2007 and 2008, we were in the process of constructing three
satellites. We have completed and placed two of these satellites into service, which resulted in
decreasing satellite capital expenditures over the three year period. We expect to launch the last of
these satellites in 2009. Additionally, our capital expenditures for broadcast facilities and equipment to
support our HD programming has decreased from 2006 to 2008 as we have largely completed the build
out of the infrastructure necessary to launch HD programming both locally and nationally.
These decreases in capital expenditures for property and equipment have been offset by an
increase in capital expenditures in Latin America for set-top receivers provided to subscribers under
lease programs. Part of our business strategy in Latin America is to increase advanced product and
multi-box penetrations; therefore, our capital expenditures in Latin America are expected to increase.
Additionally, we paid $204 million in 2008, $348 million in 2007 and $389 million in 2006 for
investments in various companies. These transactions are described in Note 6 of the Notes to the
Consolidated Financial Statements in Part II, Item 8 of this Annual Report. Also, in 2007 and 2006, we
had cash flows from investing activities resulting from net cash proceeds received from the sale of
short-term investments. Our cash spending on investment in companies is discretionary and we may
fund strategic investment opportunities should they arise in the future.
57