DIRECTV 2008 Annual Report Download - page 53
Download and view the complete annual report
Please find page 53 of the 2008 DIRECTV annual report below. You can navigate through the pages in the report by either clicking on the pages listed below, or by using the keyword search tool below to find specific information within the annual report.-
 1
1 -
2
-
3
-
4
-
5
-
6
-
7
-
8
-
9
-
10
-
11
-
12
-
13
-
14
-
15
-
16
-
17
-
18
-
19
-
20
-
21
-
22
-
23
-
24
-
25
-
26
-
27
-
28
-
29
-
30
-
31
-
32
-
33
-
34
-
35
-
36
-
37
-
38
-
39
-
40
-
41
-
42
-
 43
43 -
 44
44 -
 45
45 -
 46
46 -
 47
47 -
 48
48 -
 49
49 -
 50
50 -
 51
51 -
 52
52 -
 53
53 -
 54
54 -
 55
55 -
 56
56 -
 57
57 -
 58
58 -
 59
59 -
 60
60 -
 61
61 -
 62
62 -
 63
63 -
64
-
65
-
66
-
67
-
68
-
69
-
70
-
71
-
72
-
73
-
74
-
75
-
76
-
77
-
78
-
79
-
80
-
81
-
82
-
83
-
84
-
85
-
86
-
87
-
88
-
89
-
90
-
91
-
92
-
93
-
94
-
95
-
96
-
97
-
98
-
99
-
100
-
101
-
102
-
103
-
104
-
105
-
106
-
107
-
108
-
109
-
110
-
111
-
112
-
113
-
114
-
115
-
116
-
117
-
118
-
119
-
120
-
121
-
122
-
123
-
124
-
125
-
126
-
127
-
128
-
129
-
130
-
131
-
132
-
133
-
134
-
135
-
136
-
137
-
138
-
139
-
140
-
141
-
142
 |
 |

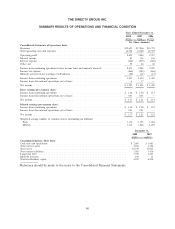
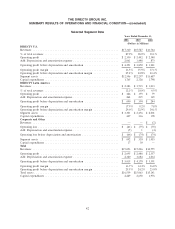
THE DIRECTV GROUP, INC.
SUMMARY RESULTS OF OPERATIONS AND FINANCIAL CONDITION
Years Ended December 31,
2008 2007 2006
(Dollars in Millions, Except
Per Share Amounts)
Consolidated Statements of Operations Data:
Revenues ........................................................ $19,693 $17,246 $14,755
Total operating costs and expenses ........................................ 16,998 14,760 12,398
Operating profit .................................................... 2,695 2,486 2,357
Interest income .................................................... 81 111 146
Interest expense .................................................... (360) (235) (246)
Other, net ....................................................... 55 26 42
Income from continuing operations before income taxes and minority interests ............ 2,471 2,388 2,299
Income tax expense .................................................. (864) (943) (866)
Minority interests in net earnings of subsidiaries ............................... (92) (11) (13)
Income from continuing operations ........................................ 1,515 1,434 1,420
Income from discontinued operations, net of taxes .............................. 6 17 —
Net income ....................................................... $1,521 $ 1,451 $ 1,420
Basic earnings per common share:
Income from continuing operations ........................................ $ 1.36 $ 1.20 $ 1.13
Income from discontinued operations, net of taxes .............................. 0.01 0.01 —
Net income ....................................................... $ 1.37 $ 1.21 $ 1.13
Diluted earnings per common share:
Income from continuing operations ........................................ $ 1.36 $ 1.20 $ 1.12
Income from discontinued operations, net of taxes .............................. 0.01 0.01 —
Net income ....................................................... $ 1.37 $ 1.21 $ 1.12
Weighted average number of common shares outstanding (in millions)
Basic ......................................................... 1,110 1,195 1,262
Diluted ........................................................ 1,114 1,202 1,270
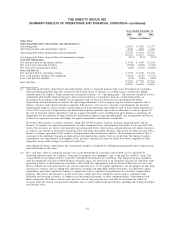
December 31,
2008 2007
(Dollars in Millions)
Consolidated Balance Sheet Data:
Cash and cash equivalents ................................................ $2,005 $ 1,083
Total current assets ..................................................... 4,044 3,146
Total assets .......................................................... 16,539 15,063
Total current liabilities ................................................... 3,585 3,434
Long-term debt ....................................................... 5,725 3,347
Minority interests ...................................................... 103 11
Total stockholders’ equity ................................................. 4,853 6,302
Reference should be made to the notes to the Consolidated Financial Statements.
40