DIRECTV 2008 Annual Report Download - page 12
Download and view the complete annual report
Please find page 12 of the 2008 DIRECTV annual report below. You can navigate through the pages in the report by either clicking on the pages listed below, or by using the keyword search tool below to find specific information within the annual report.-
 1
1 -
 2
2 -
 3
3 -
 4
4 -
 5
5 -
 6
6 -
 7
7 -
 8
8 -
 9
9 -
 10
10 -
 11
11 -
 12
12 -
 13
13 -
 14
14 -
 15
15 -
 16
16 -
 17
17 -
 18
18 -
 19
19 -
 20
20 -
 21
21 -
 22
22 -
23
-
24
-
25
-
26
-
27
-
28
-
29
-
30
-
31
-
32
-
33
-
34
-
35
-
36
-
37
-
38
-
39
-
40
-
41
-
42
-
43
-
44
-
45
-
46
-
47
-
48
-
49
-
50
-
51
-
52
-
53
-
54
-
55
-
56
-
57
-
58
-
59
-
60
-
61
-
62
-
63
-
64
-
65
-
66
-
67
-
68
-
69
-
70
-
71
-
72
-
73
-
74
-
75
-
76
-
77
-
78
-
79
-
80
-
81
-
82
-
83
-
84
-
85
-
86
-
87
-
88
-
89
-
90
-
91
-
92
-
93
-
94
-
95
-
96
-
97
-
98
-
99
-
100
-
101
-
102
-
103
-
104
-
105
-
106
-
107
-
108
-
109
-
110
-
111
-
112
-
113
-
114
-
115
-
116
-
117
-
118
-
119
-
120
-
121
-
122
-
123
-
124
-
125
-
126
-
127
-
128
-
129
-
130
-
131
-
132
-
133
-
134
-
135
-
136
-
137
-
138
-
139
-
140
-
141
-
142
 |
 |
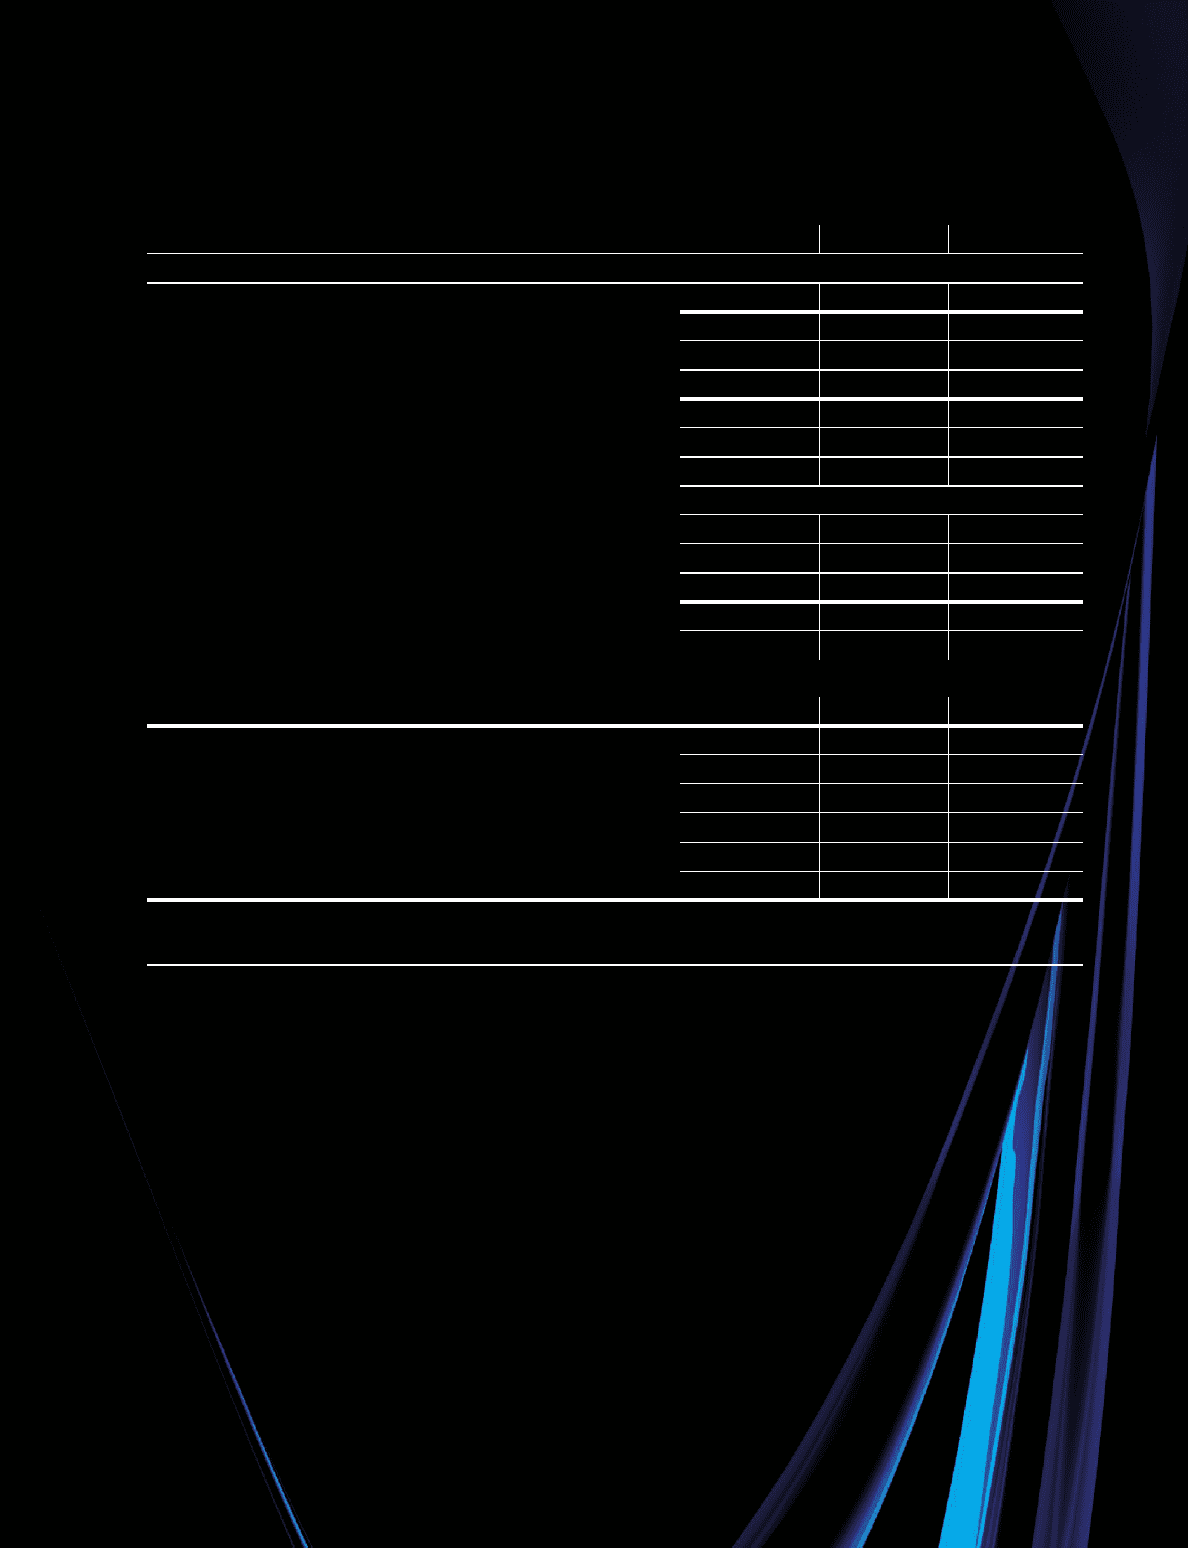
Years Ended December 31, 2008 2007 2006
(Dollars in Millions, Except Per Share Amounts)
Revenues $19,693 $17,246 $14,755
Operating prot†$2,695 $2,486 $2,357
Depreciation and amortization expense 2,320 1,684 1,034
Operating prot before depreciation and amortization $5,015 $4,170 $3,391
Income from continuing operations $1,515 $1,434 $1,420
Income from discontinued operations, net of taxes 6 17 —
Net income $1,521 $1,451 $1,420
Basic earnings per common share:
Income from continuing operations $1.36 $1.20 $1.13
Income from discontinued operations, net of taxes 0.01 0.01 —
Basic earnings per common share $1.37 $1.21 $1.13
Basic weighted average number of common shares outstanding (in millions) 1,110 1,195 1,262
Cash paid for property, equipment and satellites $2,229 $2,692 $1,976
Years Ended December 31, 2008 2007 2006
Cash and cash equivalents $2,005 $1,083 $2,499
Total current assets 4,044 3,146 4,556
Total assets 16,539 15,063 15,141
Total current liabilities 3,585 3,434 3,322
Long-term debt 5,725 3,347 3,395
Total stockholders’ equity 4,853 6,302 6,681
Number of employees (in thousands) 20 12 11
1
Operating profit before depreciation and amortization, which is a financial measure that is not determined in accordance with accounting principles
generally accepted in the United States of America, or GAAP, can be calculated by adding amounts under the caption “Depreciation and amortization
expense” to “Operating prot.” This measure should be used in conjunction with GAAP nancial measures and is not presented as an alternative measure
of operating results, as determined in accordance with GAAP. For a further discussion of operating prot before depreciation and amortization, see
Summary Data in Item 7, Management’s Discussion and Analysis of Financial Condition and Results of Operations in The DIRECTV Group, Inc.’s Form 10-K
for the year ended December 31, 2008, included in this Annual Report.
The DIRECTV Group
FINANCIAL HIGHLIGHTS