DIRECTV 2008 Annual Report Download - page 109
Download and view the complete annual report
Please find page 109 of the 2008 DIRECTV annual report below. You can navigate through the pages in the report by either clicking on the pages listed below, or by using the keyword search tool below to find specific information within the annual report.-
 1
1 -
2
-
3
-
4
-
5
-
6
-
7
-
8
-
9
-
10
-
11
-
12
-
13
-
14
-
15
-
16
-
17
-
18
-
19
-
20
-
21
-
22
-
23
-
24
-
25
-
26
-
27
-
28
-
29
-
30
-
31
-
32
-
33
-
34
-
35
-
36
-
37
-
38
-
39
-
40
-
41
-
42
-
43
-
44
-
45
-
46
-
47
-
48
-
49
-
50
-
51
-
52
-
53
-
54
-
55
-
56
-
57
-
58
-
59
-
60
-
61
-
62
-
63
-
64
-
65
-
66
-
67
-
68
-
69
-
70
-
71
-
72
-
73
-
74
-
75
-
76
-
77
-
78
-
79
-
80
-
81
-
82
-
83
-
84
-
85
-
86
-
87
-
88
-
89
-
90
-
91
-
92
-
93
-
94
-
95
-
96
-
97
-
98
-
 99
99 -
 100
100 -
 101
101 -
 102
102 -
 103
103 -
 104
104 -
 105
105 -
 106
106 -
 107
107 -
 108
108 -
 109
109 -
 110
110 -
 111
111 -
 112
112 -
 113
113 -
 114
114 -
 115
115 -
 116
116 -
 117
117 -
 118
118 -
 119
119 -
120
-
121
-
122
-
123
-
124
-
125
-
126
-
127
-
128
-
129
-
130
-
131
-
132
-
133
-
134
-
135
-
136
-
137
-
138
-
139
-
140
-
141
-
142
 |
 |

THE DIRECTV GROUP, INC.
NOTES TO THE CONSOLIDATED FINANCIAL STATEMENTS—(continued)
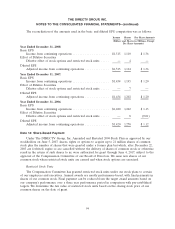
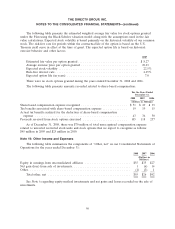
The following table presents the estimated weighted average fair value for stock options granted
under the Plan using the Black-Scholes valuation model along with the assumptions used in the fair
value calculations. Expected stock volatility is based primarily on the historical volatility of our common
stock. The risk-free rate for periods within the contractual life of the option is based on the U.S.
Treasury yield curve in effect at the time of grant. The expected option life is based on historical
exercise behavior and other factors.
2007
Estimated fair value per option granted .................................. $ 8.27
Average exercise price per option granted ................................ 22.43
Expected stock volatility ............................................. 22.5%
Risk-free interest rate ............................................... 4.65%
Expected option life (in years) ........................................ 7.0
There were no stock options granted during the years ended December 31, 2008 and 2006.
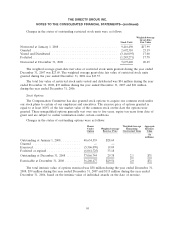
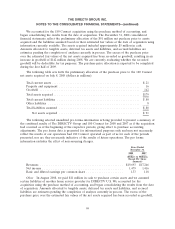
The following table presents amounts recorded related to share-based compensation:
For the Years Ended
December 31,
2008 2007 2006
(Dollars in Millions)
Share-based compensation expense recognized .......................... $ 51 $ 49 $ 39
Tax benefits associated with share-based compensation expense .............. 19 19 15
Actual tax benefits realized for the deduction of share-based compensation
expense .................................................... 43 36 50
Proceeds received from stock options exercised ......................... 105 118 257
As of December 31, 2008, there was $70 million of total unrecognized compensation expense
related to unvested restricted stock units and stock options that we expect to recognize as follows:
$45 million in 2009 and $25 million in 2010.
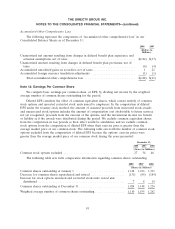
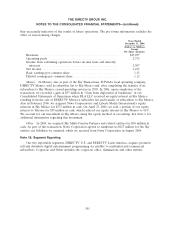
Note 15: Other Income and Expenses
The following table summarizes the components of ‘‘Other, net’’ in our Consolidated Statements of
Operations for the years ended December 31:
2008 2007 2006
(Dollars in
Millions)
Equity in earnings from unconsolidated affiliates .......................... $55 $35 $27
Net gain (loss) from sale of investments ................................. 1 (6) 14
Other .......................................................... (1) (3) 1
Total other, net ............................................... $55 $26 $42
See Note 6 regarding equity method investments and net gains and losses recorded on the sale of
investments.
96