DIRECTV 2008 Annual Report Download - page 64
Download and view the complete annual report
Please find page 64 of the 2008 DIRECTV annual report below. You can navigate through the pages in the report by either clicking on the pages listed below, or by using the keyword search tool below to find specific information within the annual report.-
 1
1 -
2
-
3
-
4
-
5
-
6
-
7
-
8
-
9
-
10
-
11
-
12
-
13
-
14
-
15
-
16
-
17
-
18
-
19
-
20
-
21
-
22
-
23
-
24
-
25
-
26
-
27
-
28
-
29
-
30
-
31
-
32
-
33
-
34
-
35
-
36
-
37
-
38
-
39
-
40
-
41
-
42
-
43
-
44
-
45
-
46
-
47
-
48
-
49
-
50
-
51
-
52
-
53
-
 54
54 -
 55
55 -
 56
56 -
 57
57 -
 58
58 -
 59
59 -
 60
60 -
 61
61 -
 62
62 -
 63
63 -
 64
64 -
 65
65 -
 66
66 -
 67
67 -
 68
68 -
 69
69 -
 70
70 -
 71
71 -
 72
72 -
 73
73 -
 74
74 -
75
-
76
-
77
-
78
-
79
-
80
-
81
-
82
-
83
-
84
-
85
-
86
-
87
-
88
-
89
-
90
-
91
-
92
-
93
-
94
-
95
-
96
-
97
-
98
-
99
-
100
-
101
-
102
-
103
-
104
-
105
-
106
-
107
-
108
-
109
-
110
-
111
-
112
-
113
-
114
-
115
-
116
-
117
-
118
-
119
-
120
-
121
-
122
-
123
-
124
-
125
-
126
-
127
-
128
-
129
-
130
-
131
-
132
-
133
-
134
-
135
-
136
-
137
-
138
-
139
-
140
-
141
-
142
 |
 |

THE DIRECTV GROUP, INC.
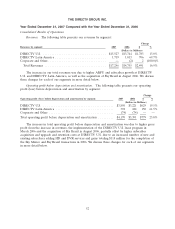
DIRECTV Latin America Segment
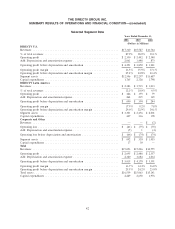
The following table provides operating results and a summary of key subscriber data for the
DIRECTV Latin America segment:
Change
2008 2007 $ %
(Dollars in Millions, Except Per
Subscriber Amounts)
Revenues ............................................ $2,383 $1,719 $ 664 38.6%
Operating profit before depreciation and amortization ............ 690 394 296 75.1%
Operating profit ....................................... 426 159 267 167.9%
Other data:
ARPU .............................................. $55.07 $48.33 $6.74 13.9%
Average monthly subscriber churn % ........................ 1.78% 1.38% — 29.0%
Total number of subscribers (000’s)(1) ....................... 3,883 3,279 604 18.4%
Gross subscriber additions (000’s) ........................... 1,393 1,080 313 29.0%
Net subscriber additions (000’s) ............................ 623 588 35 6.0%
(1) DIRECTV Latin America subscriber data exclude subscribers of the Sky Mexico platform. Net
subscriber additions as well as churn exclude the effect of the migration of approximately 19,000
subscribers from Central America to Sky Mexico in 2008 and approximately 20,000 in 2007.
The increase in net subscriber additions was due to higher gross subscriber additions mainly in
Brazil, Argentina and Venezuela, partially offset by higher churn of 1.78% in the region. The increase
in churn was due to two downward subscriber adjustments totaling 78,000 subscribers in Sky Brazil as a
result of the inconsistent application of churn policies in previous periods and the completion of the
Sky Brazil and DIRECTV Brazil business integration. Excluding these subscriber adjustments in the
current year, churn would have been 1.58%, which is higher than the prior year period primarily due to
increased competition, higher churn in our prepaid business and a more challenging macroeconomic
environment.
Revenues increased in 2008 primarily due to strong subscriber and ARPU growth. ARPU
increased mainly due to favorable exchange rates in Brazil in the first three quarters of 2008, as well as
strong ARPU growth in PanAmericana, particularly in Venezuela and Argentina.
The higher operating profit before depreciation and amortization is primarily due to the gross
profit generated from the higher revenues, partially offset by an increase in subscriber acquisition costs
mostly due to the 29% increase in gross additions, higher general and administrative expense due
primarily to $29 million in currency related transaction fees in Venezuela and increased costs related to
foreign currency exchange rate appreciation.
The higher operating profit was primarily due to the increase in operating profit before
depreciation and amortization partially offset by higher depreciation and amortization expense.
Corporate and Other
Operating loss from Corporate and Other decreased to $61 million in 2008 from $75 million in
2007.
51