DIRECTV 2008 Annual Report Download - page 140
Download and view the complete annual report
Please find page 140 of the 2008 DIRECTV annual report below. You can navigate through the pages in the report by either clicking on the pages listed below, or by using the keyword search tool below to find specific information within the annual report.-
 1
1 -
2
-
3
-
4
-
5
-
6
-
7
-
8
-
9
-
10
-
11
-
12
-
13
-
14
-
15
-
16
-
17
-
18
-
19
-
20
-
21
-
22
-
23
-
24
-
25
-
26
-
27
-
28
-
29
-
30
-
31
-
32
-
33
-
34
-
35
-
36
-
37
-
38
-
39
-
40
-
41
-
42
-
43
-
44
-
45
-
46
-
47
-
48
-
49
-
50
-
51
-
52
-
53
-
54
-
55
-
56
-
57
-
58
-
59
-
60
-
61
-
62
-
63
-
64
-
65
-
66
-
67
-
68
-
69
-
70
-
71
-
72
-
73
-
74
-
75
-
76
-
77
-
78
-
79
-
80
-
81
-
82
-
83
-
84
-
85
-
86
-
87
-
88
-
89
-
90
-
91
-
92
-
93
-
94
-
95
-
96
-
97
-
98
-
99
-
100
-
101
-
102
-
103
-
104
-
105
-
106
-
107
-
108
-
109
-
110
-
111
-
112
-
113
-
114
-
115
-
116
-
117
-
118
-
119
-
120
-
121
-
122
-
123
-
124
-
125
-
126
-
127
-
128
-
129
-
 130
130 -
 131
131 -
 132
132 -
 133
133 -
 134
134 -
 135
135 -
 136
136 -
 137
137 -
 138
138 -
 139
139 -
 140
140 -
 141
141 -
 142
142
 |
 |
27MAR200919350632
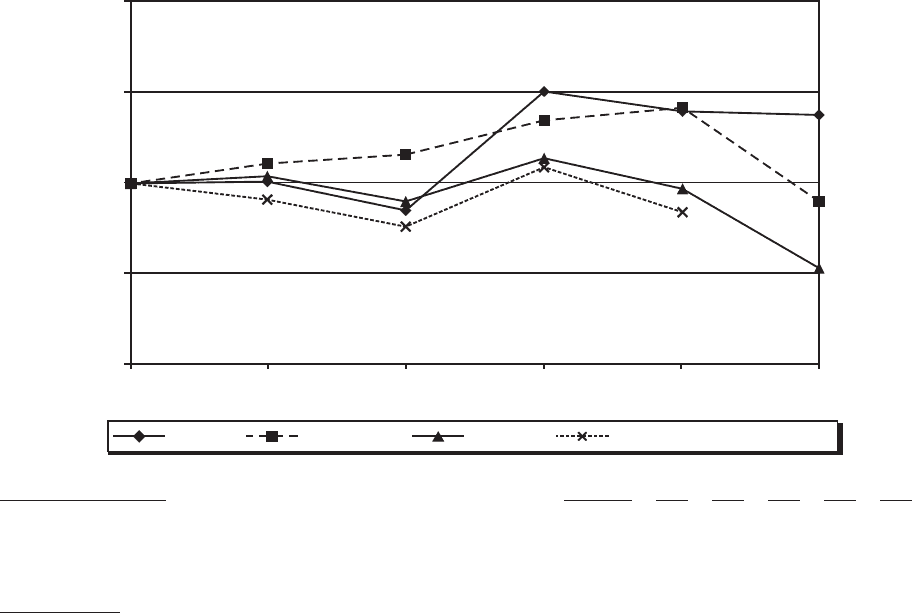
Comparative Performance
The following graph compares our five-year cumulative return to stockholders against: (a) the
Standard and Poor’s 500 Composite Stock Price Index, or the S&P 500 Index, (b) the Standard and
Poor’s 500 GICS Broadcasting & Cable TV Sub-Industry Index, or the S&P 500 Broadcasting and
Cable TV Index, and (c) an industry peer group.
The comparison assumes $100 investment in us, the S&P 500 Index, the S&P 500 Broadcasting
and Cable TV Index and the industry peer group on December 31, 2003, and reflects dividend
reinvestment and annual weighting of the industry peer indices by individual company market
capitalization. Although the companies in the industry peer indices were selected because of similar
industry characteristics, they are not entirely representative of our business.
We have included S&P 500 Broadcasting and Cable TV Index as a comparison as it was a
somewhat broader index and was well recognized within the industry. During 2008, this index was split
and the resulting Broadcasting and Cable index now only consists of 3 companies, one of which being
DIRECTV. For this reason, we are providing an industry peer group comprised of the companies that
we have identified for evaluation of executive compensation by our Compensation Committee: British
Sky Broadcasting Group, Cablevision Systems Corporation, CBS Corporation, Charter
Communications, Comcast Corporation, Dish Network Corp, Walt Disney Company, Gannett
Company, Liberty Global, Inc., Liberty Media Corporation*, News Corporation, Qwest
Communications International, Sirius XM Radio, Inc., Sprint Nextel Corporation, Time Warner
Cable Inc., Time Warner, Inc., and Viacom Inc. It is our intent to use this peer group for comparison
purposes in future disclosures and to delete the Broadcasting and Cable TV Index.
The following table sets forth our five-year cumulative return along with the S&P 500 Index, the
S&P 500 Broadcasting and Cable TV Index and the industry peer group.
Comparison of Cumulative Five Year Total Return
0
50
200
150
100
20042003 20082006 20072005
DOLLARS
DIRECTV Peer GroupS&P 500 Index S&P Broadcasting & Cable Index
Company Name / Index 31-Dec-03 2004 2005 2006 2007 2008
DIRECTV ..................................... 100 101 85 151 140 138
S&P 500 Index .................................. 100 111 116 135 142 90
S&P Broadcasting & Cable Index .................... 100 91 76 109 84
Peer Group .................................... 100 104 90 114 97 53
* Liberty Media Corporation owns approximately 54% of DIRECTV