DIRECTV 2008 Annual Report Download - page 59
Download and view the complete annual report
Please find page 59 of the 2008 DIRECTV annual report below. You can navigate through the pages in the report by either clicking on the pages listed below, or by using the keyword search tool below to find specific information within the annual report.-
 1
1 -
2
-
3
-
4
-
5
-
6
-
7
-
8
-
9
-
10
-
11
-
12
-
13
-
14
-
15
-
16
-
17
-
18
-
19
-
20
-
21
-
22
-
23
-
24
-
25
-
26
-
27
-
28
-
29
-
30
-
31
-
32
-
33
-
34
-
35
-
36
-
37
-
38
-
39
-
40
-
41
-
42
-
43
-
44
-
45
-
46
-
47
-
48
-
 49
49 -
 50
50 -
 51
51 -
 52
52 -
 53
53 -
 54
54 -
 55
55 -
 56
56 -
 57
57 -
 58
58 -
 59
59 -
 60
60 -
 61
61 -
 62
62 -
 63
63 -
 64
64 -
 65
65 -
 66
66 -
 67
67 -
 68
68 -
 69
69 -
70
-
71
-
72
-
73
-
74
-
75
-
76
-
77
-
78
-
79
-
80
-
81
-
82
-
83
-
84
-
85
-
86
-
87
-
88
-
89
-
90
-
91
-
92
-
93
-
94
-
95
-
96
-
97
-
98
-
99
-
100
-
101
-
102
-
103
-
104
-
105
-
106
-
107
-
108
-
109
-
110
-
111
-
112
-
113
-
114
-
115
-
116
-
117
-
118
-
119
-
120
-
121
-
122
-
123
-
124
-
125
-
126
-
127
-
128
-
129
-
130
-
131
-
132
-
133
-
134
-
135
-
136
-
137
-
138
-
139
-
140
-
141
-
142
 |
 |
THE DIRECTV GROUP, INC.
disconnected subscribers for the period (total subscribers disconnected, net of reconnects, during the
period divided by the number of months in the period) by average subscribers for the period.
Subscriber Count. The total number of subscribers represents the total number of subscribers
actively subscribing to our service, including seasonal subscribers, subscribers who are in the process of
relocating and commercial equivalent viewing units. In March 2008, we implemented a change in
DIRECTV U.S.’ commercial pricing and packaging to increase our competitiveness. As a result, during
the first quarter of 2008, DIRECTV U.S. made a one-time downward adjustment to the subscriber
count of approximately 71,000 subscribers related to commercial equivalent viewing units.
SAC. We calculate SAC, which represents total subscriber acquisition costs stated on a per
subscriber basis, by dividing total subscriber acquisition costs for the period by the number of gross new
subscribers acquired during the period. We calculate total subscriber acquisition costs for the period by
adding together ‘‘Subscriber acquisition costs’’ expensed during the period and the amount of cash paid
for equipment leased to new subscribers during the period.
EXECUTIVE OVERVIEW AND OUTLOOK
The United States and the other countries in which we operate are currently undergoing a period
of substantial economic uncertainty. A more severe downturn in economic activity could have a
detrimental impact on our forecasted revenue, operating margins, net subscriber additions, free cash
flow and net income. Please refer to ‘‘Risk Factors’’ in Item 1A for a further discussion of risks which
may affect forecasted results or our business generally.
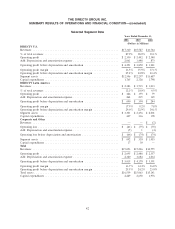
DIRECTV U.S. Segment
The following discussion of revenues and operating results relates to DIRECTV U.S., which
generates 88% of our revenues.
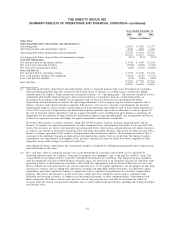
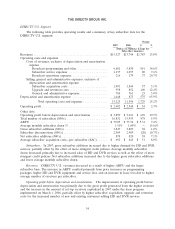
Revenues. In 2008, DIRECTV U.S. revenues increased by 11.5% due to a larger subscriber base
and a 6.1% increase in ARPU. In 2009, we anticipate revenues will increase in the high single-digit
percentage range due to an increase in total subscribers and ARPU growth of about 4%. ARPU
increases are expected to be driven primarily by price increases and the higher penetration of advanced
products but will be lower than in 2008 due to the ongoing impact of more competitive promotions
offered to both new and existing customers, as well as lower revenues in 2009 from the completion of
the lease of one of our backup satellites in early 2009. After accounting for churn, our net new
subscriber additions in 2008 were 861,000 which increased our total subscriber base by 5.1% to
17.6 million customers. In 2009, we expect net new subscriber additions to approximate the net new
subscriber additions in 2008 due to increased gross additions offset by higher subscriber disconnections.
Operating Results. In 2008, DIRECTV U.S. operating profit before depreciation and amortization
increased 14.1% to $4,391 million and operating profit before depreciation and amortization margin
improved from 24.8% in 2007 to 25.4% in 2008. These increases were primarily due to the gross profit
generated from the higher revenues, partially offset by higher subscriber acquisition and upgrade and
retention costs for the increased number of new and existing customers adding HD and DVR services,
as well as increased general and administrative costs.
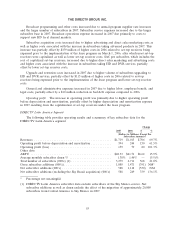
In 2009 for DIRECTV U.S. we expect a modest increase in both operating profit before
depreciation and amortization and operating profit before depreciation and amortization margin over
the 2008 results. These improvements are anticipated to be due to the expected increase in revenues,
partially offset by modest increases in certain of our significant cost categories.
46