DIRECTV 2008 Annual Report Download - page 51
Download and view the complete annual report
Please find page 51 of the 2008 DIRECTV annual report below. You can navigate through the pages in the report by either clicking on the pages listed below, or by using the keyword search tool below to find specific information within the annual report.-
 1
1 -
2
-
3
-
4
-
5
-
6
-
7
-
8
-
9
-
10
-
11
-
12
-
13
-
14
-
15
-
16
-
17
-
18
-
19
-
20
-
21
-
22
-
23
-
24
-
25
-
26
-
27
-
28
-
29
-
30
-
31
-
32
-
33
-
34
-
35
-
36
-
37
-
38
-
39
-
40
-
 41
41 -
 42
42 -
 43
43 -
 44
44 -
 45
45 -
 46
46 -
 47
47 -
 48
48 -
 49
49 -
 50
50 -
 51
51 -
 52
52 -
 53
53 -
 54
54 -
 55
55 -
 56
56 -
 57
57 -
 58
58 -
 59
59 -
 60
60 -
 61
61 -
62
-
63
-
64
-
65
-
66
-
67
-
68
-
69
-
70
-
71
-
72
-
73
-
74
-
75
-
76
-
77
-
78
-
79
-
80
-
81
-
82
-
83
-
84
-
85
-
86
-
87
-
88
-
89
-
90
-
91
-
92
-
93
-
94
-
95
-
96
-
97
-
98
-
99
-
100
-
101
-
102
-
103
-
104
-
105
-
106
-
107
-
108
-
109
-
110
-
111
-
112
-
113
-
114
-
115
-
116
-
117
-
118
-
119
-
120
-
121
-
122
-
123
-
124
-
125
-
126
-
127
-
128
-
129
-
130
-
131
-
132
-
133
-
134
-
135
-
136
-
137
-
138
-
139
-
140
-
141
-
142
 |
 |

THE DIRECTV GROUP, INC.
ITEM 6. SELECTED FINANCIAL DATA
Years Ended and As of December 31,
2008 2007 2006 2005 2004
(Dollars in Millions, Except Per Share Amounts)
Consolidated Statements of Operations Data:
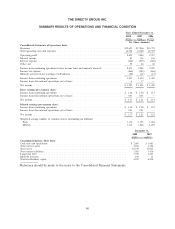
Revenues ................................ $19,693 $17,246 $14,755 $13,164 $11,360
Total operating costs and expenses .............. 16,998 14,760 12,398 12,531 13,479
Operating profit (loss) ...................... $ 2,695 $ 2,486 $ 2,357 $ 633 $(2,119)
Income (loss) from continuing operations before
cumulative effect of accounting changes ........ $ 1,515 $ 1,434 $ 1,420 $ 305 $(1,056)
Income (loss) from discontinued operations, net of
taxes ................................. 6 17 — 31 (582)
Cumulative effect of accounting changes, net of taxes .————(311)
Net income (loss) .......................... $ 1,521 $ 1,451 $ 1,420 $ 336 $(1,949)
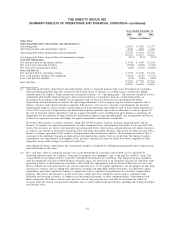
Basic earnings (loss) per common share:
Income (loss) from continuing operations before
cumulative effect of accounting changes ........ $ 1.36 $ 1.20 $ 1.13 $ 0.22 $ (0.77)
Diluted earnings (loss) per common share:
Income (loss) from continuing operations before
cumulative effect of accounting changes ........ $ 1.36 $ 1.20 $ 1.12 $ 0.22 $ (0.77)
Weighted average number of common shares
outstanding (in millions):
Basic ................................... 1,110 1,195 1,262 1,388 1,385
Diluted ................................. 1,114 1,202 1,270 1,395 1,385
Consolidated Balance Sheet Data:
Total assets .............................. $16,539 $15,063 $15,141 $15,630 $14,324
Obligations under capital leases ................ 584 57 91 80 108
Long-term debt ........................... 5,725 3,347 3,395 3,405 2,410
Total stockholders’ equity .................... 4,853 6,302 6,681 7,940 7,507
In 2004, total operating costs and expenses include a $1.466 billion charge recorded for the impairment
of SPACEWAY assets. Also in 2004, we recorded income from discontinued operations related to the
results of operations and the sale of our PanAmSat Corporation and Hughes Software Systems Limited
businesses, which we sold in 2004. The $311 million cumulative effect of accounting change, net of
taxes, in 2004 was due to DIRECTV U.S. changing its method of accounting for subscriber acquisition,
upgrade and retention costs.
See the Notes to the Consolidated Financial Statements and Management’s Discussion and Analysis of
Financial Condition and Results of Operations for additional information regarding other significant
transactions during each of the three years in the period ended December 31, 2008.
***
38