DIRECTV 2008 Annual Report Download - page 66
Download and view the complete annual report
Please find page 66 of the 2008 DIRECTV annual report below. You can navigate through the pages in the report by either clicking on the pages listed below, or by using the keyword search tool below to find specific information within the annual report.-
 1
1 -
2
-
3
-
4
-
5
-
6
-
7
-
8
-
9
-
10
-
11
-
12
-
13
-
14
-
15
-
16
-
17
-
18
-
19
-
20
-
21
-
22
-
23
-
24
-
25
-
26
-
27
-
28
-
29
-
30
-
31
-
32
-
33
-
34
-
35
-
36
-
37
-
38
-
39
-
40
-
41
-
42
-
43
-
44
-
45
-
46
-
47
-
48
-
49
-
50
-
51
-
52
-
53
-
54
-
55
-
 56
56 -
 57
57 -
 58
58 -
 59
59 -
 60
60 -
 61
61 -
 62
62 -
 63
63 -
 64
64 -
 65
65 -
 66
66 -
 67
67 -
 68
68 -
 69
69 -
 70
70 -
 71
71 -
 72
72 -
 73
73 -
 74
74 -
 75
75 -
 76
76 -
77
-
78
-
79
-
80
-
81
-
82
-
83
-
84
-
85
-
86
-
87
-
88
-
89
-
90
-
91
-
92
-
93
-
94
-
95
-
96
-
97
-
98
-
99
-
100
-
101
-
102
-
103
-
104
-
105
-
106
-
107
-
108
-
109
-
110
-
111
-
112
-
113
-
114
-
115
-
116
-
117
-
118
-
119
-
120
-
121
-
122
-
123
-
124
-
125
-
126
-
127
-
128
-
129
-
130
-
131
-
132
-
133
-
134
-
135
-
136
-
137
-
138
-
139
-
140
-
141
-
142
 |
 |

THE DIRECTV GROUP, INC.
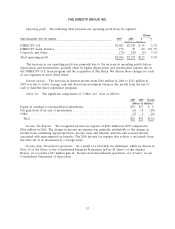
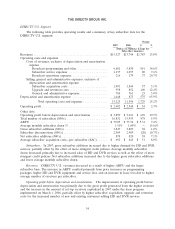
Operating profit. The following table presents our operating profit (loss) by segment:
Change
Operating profit (loss) by segment: 2007 2006 $ %
(Dollars in Millions)
DIRECTV U.S. ....................................... $2,402 $2,348 $ 54 2.3%
DIRECTV Latin America ................................ 159 79 80 101.3%
Corporate and Other .................................... (75) (70) (5) 7.1%
Total operating profit .................................... $2,486 $2,357 $129 5.5%
The increase in our operating profit was primarily due to the increase in operating profits before
depreciation and amortization, partially offset by higher depreciation and amortization expense due to
the DIRECTV U.S. lease program and the acquisition of Sky Brazil. We discuss these changes for each
of our segments in more detail below.
Interest income. The decrease in interest income from $146 million in 2006 to $111 million in
2007 was due to lower average cash and short-term investment balances due mostly from the use of
cash to fund the share repurchase programs.
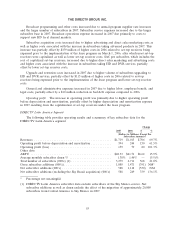
Other, net. The significant components of ‘‘Other, net’’ were as follows:
2007 2006 Change
(Dollars in Millions)
Equity in earnings of unconsolidated subsidiaries ........................ $35 $27 $ 8
Net gain (loss) from sale of investments ............................... (6) 14 (20)
Other ........................................................ (3) 1 (4)
Total ....................................................... $26 $42 $(16)
Income Tax Expense. We recognized income tax expense of $943 million in 2007 compared to
$866 million in 2006. The change in income tax expense was primarily attributable to the change in
income from continuing operations before income taxes and minority interests and accrued interest
associated with unrecognized tax benefits. The 2006 income tax expense also reflects a tax benefit from
the write-off of an investment in a foreign entity.
Income from discontinued operations. As a result of a favorable tax settlement, which we discuss in
Note 19 of the Notes to the Consolidated Financial Statements in Part II, Item 8 of this Annual
Report, we recorded a $17 million gain in ‘‘Income from discontinued operations, net of taxes’’ in our
Consolidated Statements of Operations.
53