DIRECTV 2008 Annual Report Download - page 62
Download and view the complete annual report
Please find page 62 of the 2008 DIRECTV annual report below. You can navigate through the pages in the report by either clicking on the pages listed below, or by using the keyword search tool below to find specific information within the annual report.-
 1
1 -
2
-
3
-
4
-
5
-
6
-
7
-
8
-
9
-
10
-
11
-
12
-
13
-
14
-
15
-
16
-
17
-
18
-
19
-
20
-
21
-
22
-
23
-
24
-
25
-
26
-
27
-
28
-
29
-
30
-
31
-
32
-
33
-
34
-
35
-
36
-
37
-
38
-
39
-
40
-
41
-
42
-
43
-
44
-
45
-
46
-
47
-
48
-
49
-
50
-
51
-
 52
52 -
 53
53 -
 54
54 -
 55
55 -
 56
56 -
 57
57 -
 58
58 -
 59
59 -
 60
60 -
 61
61 -
 62
62 -
 63
63 -
 64
64 -
 65
65 -
 66
66 -
 67
67 -
 68
68 -
 69
69 -
 70
70 -
 71
71 -
 72
72 -
73
-
74
-
75
-
76
-
77
-
78
-
79
-
80
-
81
-
82
-
83
-
84
-
85
-
86
-
87
-
88
-
89
-
90
-
91
-
92
-
93
-
94
-
95
-
96
-
97
-
98
-
99
-
100
-
101
-
102
-
103
-
104
-
105
-
106
-
107
-
108
-
109
-
110
-
111
-
112
-
113
-
114
-
115
-
116
-
117
-
118
-
119
-
120
-
121
-
122
-
123
-
124
-
125
-
126
-
127
-
128
-
129
-
130
-
131
-
132
-
133
-
134
-
135
-
136
-
137
-
138
-
139
-
140
-
141
-
142
 |
 |

THE DIRECTV GROUP, INC.
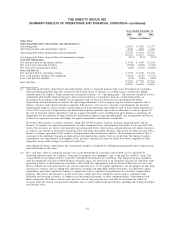
Income from discontinued operations, net of taxes. During 2008, we recorded a net $6 million
adjustment as a result of the expiration of the statute of limitations in the federal jurisdiction offset by
the write-off of foreign incentive income tax benefits related to previously divested businesses. During
2007, we recorded a $17 million reduction to our unrecognized tax benefits as a result of a settlement
of a foreign withholding dispute from a previously divested business.
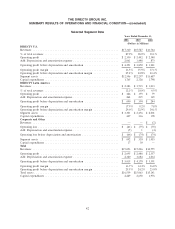
DIRECTV U.S. Segment
The following table provides operating results and a summary of key subscriber data for the
DIRECTV U.S. segment:
Change
2008 2007 $ %
(Dollars in Millions, Except Per
Subscriber Amounts)
Revenues ........................................... $17,310 $15,527 $1,783 11.5%
Operating costs and expenses
Costs of revenues, exclusive of depreciation and amortization
expense
Broadcast programming and other .................. 7,424 6,681 743 11.1%
Subscriber service expenses ....................... 1,139 1,137 2 0.2%
Broadcast operations expenses ..................... 265 216 49 22.7%
Selling, general and administrative expenses, exclusive of
depreciation and amortization expense
Subscriber acquisition costs ....................... 2,191 1,901 290 15.3%
Upgrade and retention costs ...................... 1,027 958 69 7.2%
General and administrative expenses ................ 873 784 89 11.4%
Depreciation and amortization expense ..................... 2,061 1,448 613 42.3%
Total operating costs and expenses .............. 14,980 13,125 1,855 14.1%
Operating profit ...................................... $ 2,330 $ 2,402 $ (72) (3.0)%
Other data:
Operating profit before depreciation and amortization .......... $ 4,391 $ 3,850 $ 541 14.1%
Total number of subscribers (000’s)(1) ...................... 17,621 16,831 790 4.7%
ARPU ............................................. $ 83.90 $ 79.05 $ 4.85 6.1%
Average monthly subscriber churn % ...................... 1.47% 1.51% — (2.6)%
Gross subscriber additions (000’s) ......................... 3,904 3,847 57 1.5%
Subscriber disconnections (000’s) ......................... 3,043 2,969 74 2.5%
Net subscriber additions (000’s) .......................... 861 878 (17) (1.9)%
Average subscriber acquisition costs—per subscriber (SAC) ...... $ 715 $ 692 $ 23 3.3%
(1) As discussed above in ‘‘Key Terminology,’’ during 2008, we had a one-time downward adjustment
to our subscriber count of approximately 71,000 subscribers related to commercial equivalent
viewing units. This adjustment did not affect our revenue, operating profit, cash flows, net
subscriber additions or average monthly subscriber churn.
Subscribers. In 2008, gross subscriber additions increased primarily due to growth in the direct
sales and retail distribution channels due in large part to more attractive promotions and higher
demand for HD and DVR services, partially offset by the loss of a distribution relationship with
BellSouth during the last three quarters of 2008. Average monthly subscriber churn decreased primarily
49