DIRECTV 2008 Annual Report Download - page 55
Download and view the complete annual report
Please find page 55 of the 2008 DIRECTV annual report below. You can navigate through the pages in the report by either clicking on the pages listed below, or by using the keyword search tool below to find specific information within the annual report.-
 1
1 -
2
-
3
-
4
-
5
-
6
-
7
-
8
-
9
-
10
-
11
-
12
-
13
-
14
-
15
-
16
-
17
-
18
-
19
-
20
-
21
-
22
-
23
-
24
-
25
-
26
-
27
-
28
-
29
-
30
-
31
-
32
-
33
-
34
-
35
-
36
-
37
-
38
-
39
-
40
-
41
-
42
-
43
-
44
-
 45
45 -
 46
46 -
 47
47 -
 48
48 -
 49
49 -
 50
50 -
 51
51 -
 52
52 -
 53
53 -
 54
54 -
 55
55 -
 56
56 -
 57
57 -
 58
58 -
 59
59 -
 60
60 -
 61
61 -
 62
62 -
 63
63 -
 64
64 -
 65
65 -
66
-
67
-
68
-
69
-
70
-
71
-
72
-
73
-
74
-
75
-
76
-
77
-
78
-
79
-
80
-
81
-
82
-
83
-
84
-
85
-
86
-
87
-
88
-
89
-
90
-
91
-
92
-
93
-
94
-
95
-
96
-
97
-
98
-
99
-
100
-
101
-
102
-
103
-
104
-
105
-
106
-
107
-
108
-
109
-
110
-
111
-
112
-
113
-
114
-
115
-
116
-
117
-
118
-
119
-
120
-
121
-
122
-
123
-
124
-
125
-
126
-
127
-
128
-
129
-
130
-
131
-
132
-
133
-
134
-
135
-
136
-
137
-
138
-
139
-
140
-
141
-
142
 |
 |

THE DIRECTV GROUP, INC.
SUMMARY RESULTS OF OPERATIONS AND FINANCIAL CONDITION—(concluded)
Selected Segment Data
Years Ended December 31,
2008 2007 2006
(Dollars in Millions)
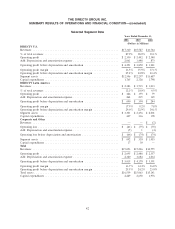
DIRECTV U.S.
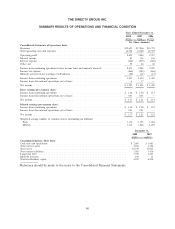
Revenues ................................................... $17,310 $15,527 $13,744
% of total revenues ............................................ 87.9% 90.0% 93.1%
Operating profit .............................................. $ 2,330 $ 2,402 $ 2,348
Add: Depreciation and amortization expense ........................... 2,061 1,448 873
Operating profit before depreciation and amortization .................... $4,391 $ 3,850 $ 3,221
Operating profit margin ......................................... 13.5% 15.5% 17.1%
Operating profit before depreciation and amortization margin ............... 25.4% 24.8% 23.4%
Segment assets ............................................... $12,546 $12,297 $11,687
Capital expenditures ............................................ 1,765 2,326 1,798
DIRECTV Latin America
Revenues ................................................... $2,383 $ 1,719 $ 1,013
% of total revenues ............................................ 12.1% 10.0% 6.9%
Operating profit .............................................. $ 426 $ 159 $ 79
Add: Depreciation and amortization expense ........................... 264 235 165
Operating profit before depreciation and amortization .................... $ 690 $ 394 $ 244
Operating profit margin ......................................... 17.9% 9.2% 7.8%
Operating profit before depreciation and amortization margin ............... 29.0% 22.9% 24.1%
Segment assets ............................................... $ 3,301 $ 2,456 $ 2,001
Capital expenditures ............................................ 447 336 178
Corporate and Other
Revenues ................................................... — — $ (2)
Operating loss ................................................ $ (61) $ (75) $ (70)
Add: Depreciation and amortization expense ........................... (5) 1 (4)
Operating loss before depreciation and amortization ...................... $ (66) $ (74) $ (74)
Segment assets ............................................... $ 692 $ 310 $1,453
Capital expenditures ............................................ 17 30 —
Total
Revenues ................................................... $19,693 $17,246 $14,755
Operating profit .............................................. $ 2,695 $ 2,486 $ 2,357
Add: Depreciation and amortization expense ........................... 2,320 1,684 1,034
Operating profit before depreciation and amortization .................... $5,015 $ 4,170 $ 3,391
Operating profit margin ......................................... 13.7% 14.4% 16.0%
Operating profit before depreciation and amortization margin ............... 25.5% 24.2% 23.0%
Total assets .................................................. $16,539 $15,063 $15,141
Capital expenditures ............................................ 2,229 2,692 1,976
42