DIRECTV 2008 Annual Report Download - page 116
Download and view the complete annual report
Please find page 116 of the 2008 DIRECTV annual report below. You can navigate through the pages in the report by either clicking on the pages listed below, or by using the keyword search tool below to find specific information within the annual report.-
 1
1 -
2
-
3
-
4
-
5
-
6
-
7
-
8
-
9
-
10
-
11
-
12
-
13
-
14
-
15
-
16
-
17
-
18
-
19
-
20
-
21
-
22
-
23
-
24
-
25
-
26
-
27
-
28
-
29
-
30
-
31
-
32
-
33
-
34
-
35
-
36
-
37
-
38
-
39
-
40
-
41
-
42
-
43
-
44
-
45
-
46
-
47
-
48
-
49
-
50
-
51
-
52
-
53
-
54
-
55
-
56
-
57
-
58
-
59
-
60
-
61
-
62
-
63
-
64
-
65
-
66
-
67
-
68
-
69
-
70
-
71
-
72
-
73
-
74
-
75
-
76
-
77
-
78
-
79
-
80
-
81
-
82
-
83
-
84
-
85
-
86
-
87
-
88
-
89
-
90
-
91
-
92
-
93
-
94
-
95
-
96
-
97
-
98
-
99
-
100
-
101
-
102
-
103
-
104
-
105
-
 106
106 -
 107
107 -
 108
108 -
 109
109 -
 110
110 -
 111
111 -
 112
112 -
 113
113 -
 114
114 -
 115
115 -
 116
116 -
 117
117 -
 118
118 -
 119
119 -
 120
120 -
 121
121 -
 122
122 -
 123
123 -
 124
124 -
 125
125 -
 126
126 -
127
-
128
-
129
-
130
-
131
-
132
-
133
-
134
-
135
-
136
-
137
-
138
-
139
-
140
-
141
-
142
 |
 |

THE DIRECTV GROUP, INC.
NOTES TO THE CONSOLIDATED FINANCIAL STATEMENTS—(continued)
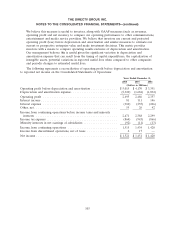
We believe this measure is useful to investors, along with GAAP measures (such as revenues,
operating profit and net income), to compare our operating performance to other communications,
entertainment and media service providers. We believe that investors use current and projected
operating profit (loss) before depreciation and amortization and similar measures to estimate our
current or prospective enterprise value and make investment decisions. This metric provides
investors with a means to compare operating results exclusive of depreciation and amortization.
Our management believes this is useful given the significant variation in depreciation and
amortization expense that can result from the timing of capital expenditures, the capitalization of
intangible assets, potential variations in expected useful lives when compared to other companies
and periodic changes to estimated useful lives.
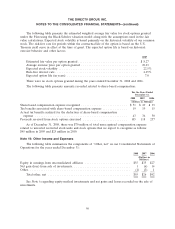
The following represents a reconciliation of operating profit before depreciation and amortization
to reported net income on the Consolidated Statements of Operations:
Years Ended December 31,
2008 2007 2006
(Dollars in Millions)
Operating profit before depreciation and amortization ............... $5,015 $ 4,170 $ 3,391
Depreciation and amortization expense .......................... (2,320) (1,684) (1,034)
Operating profit .......................................... 2,695 2,486 2,357
Interest income ........................................... 81 111 146
Interest expense .......................................... (360) (235) (246)
Other, net ............................................... 55 26 42
Income from continuing operations before income taxes and minority
interests .............................................. 2,471 2,388 2,299
Income tax expense ........................................ (864) (943) (866)
Minority interests in net earnings of subsidiaries ................... (92) (11) (13)
Income from continuing operations ............................ 1,515 1,434 1,420
Income from discontinued operations, net of taxes ................. 6 17 —
Net income .............................................. $1,521 $ 1,451 $ 1,420
103