DIRECTV 2008 Annual Report Download - page 67
Download and view the complete annual report
Please find page 67 of the 2008 DIRECTV annual report below. You can navigate through the pages in the report by either clicking on the pages listed below, or by using the keyword search tool below to find specific information within the annual report.-
 1
1 -
2
-
3
-
4
-
5
-
6
-
7
-
8
-
9
-
10
-
11
-
12
-
13
-
14
-
15
-
16
-
17
-
18
-
19
-
20
-
21
-
22
-
23
-
24
-
25
-
26
-
27
-
28
-
29
-
30
-
31
-
32
-
33
-
34
-
35
-
36
-
37
-
38
-
39
-
40
-
41
-
42
-
43
-
44
-
45
-
46
-
47
-
48
-
49
-
50
-
51
-
52
-
53
-
54
-
55
-
56
-
 57
57 -
 58
58 -
 59
59 -
 60
60 -
 61
61 -
 62
62 -
 63
63 -
 64
64 -
 65
65 -
 66
66 -
 67
67 -
 68
68 -
 69
69 -
 70
70 -
 71
71 -
 72
72 -
 73
73 -
 74
74 -
 75
75 -
 76
76 -
 77
77 -
78
-
79
-
80
-
81
-
82
-
83
-
84
-
85
-
86
-
87
-
88
-
89
-
90
-
91
-
92
-
93
-
94
-
95
-
96
-
97
-
98
-
99
-
100
-
101
-
102
-
103
-
104
-
105
-
106
-
107
-
108
-
109
-
110
-
111
-
112
-
113
-
114
-
115
-
116
-
117
-
118
-
119
-
120
-
121
-
122
-
123
-
124
-
125
-
126
-
127
-
128
-
129
-
130
-
131
-
132
-
133
-
134
-
135
-
136
-
137
-
138
-
139
-
140
-
141
-
142
 |
 |

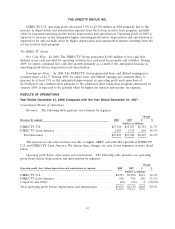
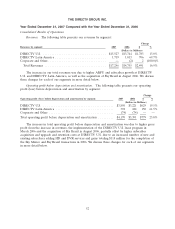
THE DIRECTV GROUP, INC.
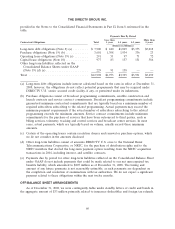
DIRECTV U.S. Segment
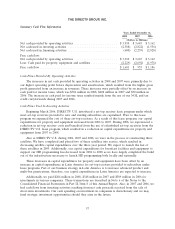
The following table provides operating results and a summary of key subscriber data for the
DIRECTV U.S. segment:
Change
2007 2006 $ %
(Dollars in Millions, Except Per
Subscriber Amounts)
Revenues .......................................... $15,527 $13,744 $1,783 13.0%
Operating costs and expenses
Costs of revenues, exclusive of depreciation and amortization
expense
Broadcast programming and other ................. 6,681 5,830 851 14.6%
Subscriber service expenses ...................... 1,137 1,057 80 7.6%
Broadcast operations expenses .................... 216 179 37 20.7%
Selling, general and administrative expenses, exclusive of
depreciation and amortization expense
Subscriber acquisition costs ...................... 1,901 1,844 57 3.1%
Upgrade and retention costs ..................... 958 852 106 12.4%
General and administrative expenses ............... 784 761 23 3.0%
Depreciation and amortization expense .................... 1,448 873 575 65.9%
Total operating costs and expenses .............. 13,125 11,396 1,729 15.2%
Operating profit ..................................... $ 2,402 $ 2,348 $ 54 2.3%
Other data:
Operating profit before depreciation and amortization ......... $ 3,850 $ 3,221 $ 629 19.5%
Total number of subscribers (000’s) ....................... 16,831 15,953 878 5.5%
ARPU ............................................ $ 79.05 $ 73.74 $ 5.31 7.2%
Average monthly subscriber churn % ...................... 1.51% 1.60% — (5.6)%
Gross subscriber additions (000’s) ........................ 3,847 3,809 38 1.0%
Subscriber disconnections (000’s) ......................... 2,969 2,989 (20) (0.7%)
Net subscriber additions (000’s) .......................... 878 820 58 7.1%
Average subscriber acquisition costs—per subscriber (SAC) ...... $ 692 $ 641 $ 51 8.0%
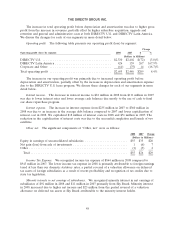
Subscribers. In 2007, gross subscriber additions increased due to higher demand for HD and DVR
services, partially offset by the effect of more stringent credit policies. Average monthly subscriber
churn decreased primarily due to increased sales of HD and DVR services as well as the effect of more
stringent credit policies. Net subscriber additions increased due to the higher gross subscriber additions
and lower average monthly subscriber churn.
Revenues. DIRECTV U.S.’ revenues increased as a result of higher ARPU and the larger
subscriber base. The increase in ARPU resulted primarily from price increases on programming
packages, higher HD and DVR equipment and service fees, and an increase in lease fees due to higher
average number of receivers per subscriber.
Operating profit before depreciation and amortization. The improvement of operating profit before
depreciation and amortization was primarily due to the gross profit generated from the higher revenues
and the increase in the amount of set-top receivers capitalized in 2007 under the lease program
implemented on March 1, 2006, partially offset by higher subscriber acquisition, upgrade and retention
costs for the increased number of new and existing customers adding HD and DVR services.
54