DIRECTV 2008 Annual Report Download - page 60
Download and view the complete annual report
Please find page 60 of the 2008 DIRECTV annual report below. You can navigate through the pages in the report by either clicking on the pages listed below, or by using the keyword search tool below to find specific information within the annual report.-
 1
1 -
2
-
3
-
4
-
5
-
6
-
7
-
8
-
9
-
10
-
11
-
12
-
13
-
14
-
15
-
16
-
17
-
18
-
19
-
20
-
21
-
22
-
23
-
24
-
25
-
26
-
27
-
28
-
29
-
30
-
31
-
32
-
33
-
34
-
35
-
36
-
37
-
38
-
39
-
40
-
41
-
42
-
43
-
44
-
45
-
46
-
47
-
48
-
49
-
 50
50 -
 51
51 -
 52
52 -
 53
53 -
 54
54 -
 55
55 -
 56
56 -
 57
57 -
 58
58 -
 59
59 -
 60
60 -
 61
61 -
 62
62 -
 63
63 -
 64
64 -
 65
65 -
 66
66 -
 67
67 -
 68
68 -
 69
69 -
 70
70 -
71
-
72
-
73
-
74
-
75
-
76
-
77
-
78
-
79
-
80
-
81
-
82
-
83
-
84
-
85
-
86
-
87
-
88
-
89
-
90
-
91
-
92
-
93
-
94
-
95
-
96
-
97
-
98
-
99
-
100
-
101
-
102
-
103
-
104
-
105
-
106
-
107
-
108
-
109
-
110
-
111
-
112
-
113
-
114
-
115
-
116
-
117
-
118
-
119
-
120
-
121
-
122
-
123
-
124
-
125
-
126
-
127
-
128
-
129
-
130
-
131
-
132
-
133
-
134
-
135
-
136
-
137
-
138
-
139
-
140
-
141
-
142
 |
 |

THE DIRECTV GROUP, INC.
DIRECTV U.S. operating profit decreased 3.0% to $2,330 million in 2008 primarily due to the
increase in depreciation and amortization expense from the set-top receiver lease program, partially
offset by increased operating profits before depreciation and amortization. Operating profit in 2009 is
expected to increase as the anticipated higher operating profit before depreciation and amortization is
expected to be only partially offset by higher depreciation and amortization expense resulting from the
set-top receiver lease program.
The DIRECTV Group
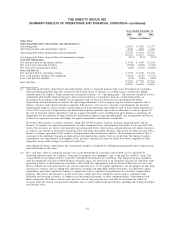
Free Cash Flow. In 2008, The DIRECTV Group generated $1,681 million of free cash flow,
defined as net cash provided by operating activities less cash paid for property and satellites. During
2009, we expect continued free cash flow growth primarily as a result of the anticipated increase in
operating profit before depreciation and amortization.
Earnings per Share. In 2008, The DIRECTV Group generated basic and diluted earnings per
common share of $1.37. During 2009, we expect basic and diluted earnings per common share to
increase by at least 15% as the anticipated improvement in operating profit and repurchase of
$2.0 billion of our common stock pursuant to the additional share repurchase program announced in
January 2009, is expected to be partially offset by higher net interest and income tax expense.
RESULTS OF OPERATIONS
Year Ended December 31, 2008 Compared with the Year Ended December 31, 2007
Consolidated Results of Operations
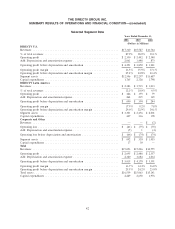
Revenues. The following table presents our revenues by segment:
Change
Revenues by segment: 2008 2007 $ %
(Dollars in Millions)
DIRECTV U.S. ..................................... $17,310 $15,527 $1,783 11.5%
DIRECTV Latin America .............................. 2,383 1,719 664 38.6%
Total Revenues ..................................... $19,693 $17,246 $2,447 14.2%
The increase in our total revenues was due to higher ARPU and subscriber growth at DIRECTV
U.S. and DIRECTV Latin America. We discuss these changes for each of our segments in more detail
below.
Operating profit before depreciation and amortization. The following table presents our operating
profit (loss) before depreciation and amortization by segment:
Change
Operating profit (loss) before depreciation and amortization by segment: 2008 2007 $ %
(Dollars in Millions)
DIRECTV U.S. ........................................ $4,391 $3,850 $541 14.1%
DIRECTV Latin America ................................. 690 394 296 75.1%
Corporate and Other .................................... (66) (74) 8 (10.8)%
Total operating profit before depreciation and amortization ......... $5,015 $4,170 $845 20.3%
47