Cisco 2015 Annual Report Download - page 99
Download and view the complete annual report
Please find page 99 of the 2015 Cisco annual report below. You can navigate through the pages in the report by either clicking on the pages listed below, or by using the keyword search tool below to find specific information within the annual report.-
 1
1 -
2
-
3
-
4
-
5
-
6
-
7
-
8
-
9
-
10
-
11
-
12
-
13
-
14
-
15
-
16
-
17
-
18
-
19
-
20
-
21
-
22
-
23
-
24
-
25
-
26
-
27
-
28
-
29
-
30
-
31
-
32
-
33
-
34
-
35
-
36
-
37
-
38
-
39
-
40
-
41
-
42
-
43
-
44
-
45
-
46
-
47
-
48
-
49
-
50
-
51
-
52
-
53
-
54
-
55
-
56
-
57
-
58
-
59
-
60
-
61
-
62
-
63
-
64
-
65
-
66
-
67
-
68
-
69
-
70
-
71
-
72
-
73
-
74
-
75
-
76
-
77
-
78
-
79
-
80
-
81
-
82
-
83
-
84
-
85
-
86
-
87
-
88
-
 89
89 -
 90
90 -
 91
91 -
 92
92 -
 93
93 -
 94
94 -
 95
95 -
 96
96 -
 97
97 -
 98
98 -
 99
99 -
 100
100 -
 101
101 -
 102
102 -
 103
103 -
 104
104 -
 105
105 -
 106
106 -
 107
107 -
 108
108 -
 109
109 -
110
-
111
-
112
-
113
-
114
-
115
-
116
-
117
-
118
-
119
-
120
-
121
-
122
-
123
-
124
-
125
-
126
-
127
-
128
-
129
-
130
-
131
-
132
-
133
-
134
-
135
-
136
-
137
-
138
-
139
-
140
 |
 |

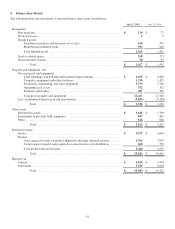
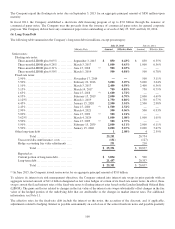
6. Balance Sheet Details
The following tables provide details of selected balance sheet items (in millions):
July 25, 2015 July 26, 2014
Inventories:
Raw materials ........................................................................ $ 114 $77
Work in process ...................................................................... 25
Finished goods:
Distributor inventory and deferred cost of sales .................................. 610 595
Manufactured finished goods .................................................... 593 606
Total finished goods ............................................................. 1,203 1,201
Service-related spares ................................................................ 258 273
Demonstration systems ............................................................... 50 35
Total ....................................................................... $ 1,627 $ 1,591
Property and equipment, net:
Gross property and equipment:
Land, buildings, and building and leasehold improvements ...................... $ 4,495 $ 4,468
Computer equipment and related software ....................................... 1,310 1,425
Production, engineering, and other equipment ................................... 5,753 5,756
Operating lease assets ........................................................... 372 362
Furniture and fixtures ........................................................... 497 509
Total gross property and equipment .............................................. 12,427 12,520
Less: accumulated depreciation and amortization ..................................... (9,095) (9,268)
Total ....................................................................... $ 3,332 $ 3,252
Other assets:
Deferred tax assets ................................................................... $ 1,648 $ 1,700
Investments in privately held companies .............................................. 897 899
Other ................................................................................. 618 668
Total ....................................................................... $ 3,163 $ 3,267
Deferred revenue:
Service ............................................................................... $ 9,757 $ 9,640
Product: ..............................................................................
Unrecognized revenue on product shipments and other deferred revenue ......... 4,766 3,924
Cash receipts related to unrecognized revenue from two-tier distributors ......... 660 578
Total product deferred revenue .................................................. 5,426 4,502
Total ....................................................................... $ 15,183 $ 14,142
Reported as:
Current ............................................................................... $ 9,824 $ 9,478
Noncurrent ........................................................................... 5,359 4,664
Total ....................................................................... $ 15,183 $ 14,142
91