Cisco 2015 Annual Report Download - page 70
Download and view the complete annual report
Please find page 70 of the 2015 Cisco annual report below. You can navigate through the pages in the report by either clicking on the pages listed below, or by using the keyword search tool below to find specific information within the annual report.-
 1
1 -
2
-
3
-
4
-
5
-
6
-
7
-
8
-
9
-
10
-
11
-
12
-
13
-
14
-
15
-
16
-
17
-
18
-
19
-
20
-
21
-
22
-
23
-
24
-
25
-
26
-
27
-
28
-
29
-
30
-
31
-
32
-
33
-
34
-
35
-
36
-
37
-
38
-
39
-
40
-
41
-
42
-
43
-
44
-
45
-
46
-
47
-
48
-
49
-
50
-
51
-
52
-
53
-
54
-
55
-
56
-
57
-
58
-
59
-
 60
60 -
 61
61 -
 62
62 -
 63
63 -
 64
64 -
 65
65 -
 66
66 -
 67
67 -
 68
68 -
 69
69 -
 70
70 -
 71
71 -
 72
72 -
 73
73 -
 74
74 -
 75
75 -
 76
76 -
 77
77 -
 78
78 -
 79
79 -
 80
80 -
81
-
82
-
83
-
84
-
85
-
86
-
87
-
88
-
89
-
90
-
91
-
92
-
93
-
94
-
95
-
96
-
97
-
98
-
99
-
100
-
101
-
102
-
103
-
104
-
105
-
106
-
107
-
108
-
109
-
110
-
111
-
112
-
113
-
114
-
115
-
116
-
117
-
118
-
119
-
120
-
121
-
122
-
123
-
124
-
125
-
126
-
127
-
128
-
129
-
130
-
131
-
132
-
133
-
134
-
135
-
136
-
137
-
138
-
139
-
140
 |
 |

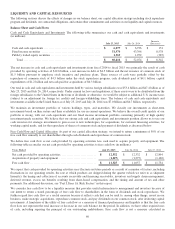
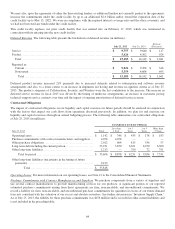
Financing Receivables and Guarantees We measure our net balance sheet exposure position related to our financing receivables
and financing guarantees by reducing the total of gross financing receivables and financing guarantees by the associated
allowances for credit loss and deferred revenue. As of July 25, 2015, our net balance sheet exposure position related to financing
receivables and financing guarantees was as follows (in millions):
FINANCING RECEIVABLES FINANCING GUARANTEES
July 25, 2015
Lease
Receivables
Loan
Receivables
Financed
Service
Contracts
and Other Total
Channel
Partner
End-User
Customers Total TOTAL
Financing receivables and
guarantees ........................ $ 3,395 $ 1,763 $ 3,573 $ 8,731 $ 288 $ 129 $ 417 $ 9,148
Allowance for credit loss .......... (259) (87) (36) (382) — — — (382)
Deferred revenue ................. (5) (13) (1,853) (1,871) (127) (107) (234) (2,105)
Net balance sheet exposure . . . $ 3,131 $ 1,663 $ 1,684 $ 6,478 $ 161 $ 22 $ 183 $ 6,661
Financing Receivables Financing receivables less unearned income increased by 4% compared with the end of fiscal 2014. The
change was primarily due to an 11% increase in financed service contracts and other, and a 5% increase in loan receivables,
partially offset by a 4% decrease in lease receivables. We provide financing to certain end-user customers and channel partners to
enable sales of our products, services, and networking solutions. These financing arrangements include leases, financed service
contracts, and loans. Arrangements related to leases are generally collateralized by a security interest in the underlying assets.
Lease receivables include sales-type and direct-financing leases. We also provide certain qualified customers financing for long-
term service contracts, which primarily relate to technical support services. Our loan financing arrangements may include not
only financing the acquisition of our products and services but also providing additional funds for other costs associated with
network installation and integration of our products and services. We expect to continue to expand the use of our financing
programs in the near term.
Financing Guarantees In the normal course of business, third parties may provide financing arrangements to our customers and
channel partners under financing programs. The financing arrangements to customers provided by third parties are related to
leases and loans and typically have terms of up to three years. In some cases, we provide guarantees to third parties for these lease
and loan arrangements. The financing arrangements to channel partners consist of revolving short-term financing provided by
third parties, generally with payment terms ranging from 60 to 90 days. In certain instances, these financing arrangements result
in a transfer of our receivables to the third party. The receivables are derecognized upon transfer, as these transfers qualify as true
sales, and we receive payments for the receivables from the third party based on our standard payment terms. The volume of
channel partner financing was $25.9 billion, $24.6 billion, and $23.8 billion in fiscal 2015, 2014, and 2013, respectively. These
financing arrangements facilitate the working capital requirements of the channel partners, and in some cases, we guarantee a
portion of these arrangements. The balance of the channel partner financing subject to guarantees was $1.2 billion as of each of
July 25, 2015 and July 26, 2014. We could be called upon to make payments under these guarantees in the event of nonpayment
by the channel partners or end-user customers. Historically, our payments under these arrangements have been immaterial. Where
we provide a guarantee, we defer the revenue associated with the channel partner and end-user financing arrangement in
accordance with revenue recognition policies, or we record a liability for the fair value of the guarantees. In either case, the
deferred revenue is recognized as revenue when the guarantee is removed.
Deferred Revenue Related to Financing Receivables and Guarantees The majority of the deferred revenue in the preceding table
is related to financed service contracts. The majority of the revenue related to financed service contracts, which primarily relates
to technical support services, is deferred as the revenue related to financed service contracts is recognized ratably over the period
during which the related services are to be performed. A portion of the revenue related to lease and loan receivables is also
deferred and included in deferred product revenue based on revenue recognition criteria not currently having been met.
62