Cisco 2015 Annual Report Download - page 60
Download and view the complete annual report
Please find page 60 of the 2015 Cisco annual report below. You can navigate through the pages in the report by either clicking on the pages listed below, or by using the keyword search tool below to find specific information within the annual report.-
 1
1 -
2
-
3
-
4
-
5
-
6
-
7
-
8
-
9
-
10
-
11
-
12
-
13
-
14
-
15
-
16
-
17
-
18
-
19
-
20
-
21
-
22
-
23
-
24
-
25
-
26
-
27
-
28
-
29
-
30
-
31
-
32
-
33
-
34
-
35
-
36
-
37
-
38
-
39
-
40
-
41
-
42
-
43
-
44
-
45
-
46
-
47
-
48
-
49
-
 50
50 -
 51
51 -
 52
52 -
 53
53 -
 54
54 -
 55
55 -
 56
56 -
 57
57 -
 58
58 -
 59
59 -
 60
60 -
 61
61 -
 62
62 -
 63
63 -
 64
64 -
 65
65 -
 66
66 -
 67
67 -
 68
68 -
 69
69 -
 70
70 -
71
-
72
-
73
-
74
-
75
-
76
-
77
-
78
-
79
-
80
-
81
-
82
-
83
-
84
-
85
-
86
-
87
-
88
-
89
-
90
-
91
-
92
-
93
-
94
-
95
-
96
-
97
-
98
-
99
-
100
-
101
-
102
-
103
-
104
-
105
-
106
-
107
-
108
-
109
-
110
-
111
-
112
-
113
-
114
-
115
-
116
-
117
-
118
-
119
-
120
-
121
-
122
-
123
-
124
-
125
-
126
-
127
-
128
-
129
-
130
-
131
-
132
-
133
-
134
-
135
-
136
-
137
-
138
-
139
-
140
 |
 |

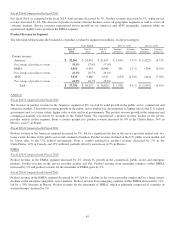
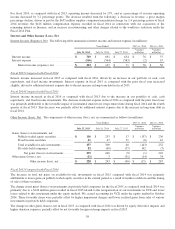
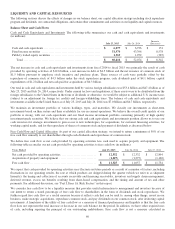
Fiscal 2014 Compared with Fiscal 2013
The following table summarizes the key factors that contributed to the change in product gross margin percentage from fiscal
2013 to fiscal 2014:
Product
Gross Margin
Percentage
Fiscal 2013 .................................................................................................... 59.1 %
Product pricing ................................................................................................ (3.1)%
Supplier component remediation charge ....................................................................... (1.8)%
Mix of products sold .......................................................................................... (0.5)%
Amortization of purchased intangible assets ................................................................... (0.5)%
Productivity (1) ................................................................................................ 3.0 %
TiVo patent litigation settlement ............................................................................... 0.5 %
Acquisition fair value adjustment to inventory and other ....................................................... 0.1 %
Fiscal 2014 .................................................................................................... 56.8 %
Product gross margin decreased by 2.3 percentage points compared with fiscal 2013. The decrease in product gross margin was
driven by unfavorable impacts from product pricing, which were driven by typical market factors and impacted each of our
geographic segments and customer markets. The decrease was also due, in part, to the supplier component remediation charge of
$655 million to product cost of sales recorded in fiscal 2014 discussed above. In addition, the shift in the mix of products sold
decreased our product gross margin, primarily as a result of a revenue increase in our Cisco Unified Computing System products
and decreased revenue from our higher margin core products, partially offset by decreased revenue from our Service Provider
Video products. Our product gross margin for fiscal 2014 was also negatively impacted by higher amortization expense of
purchased intangible assets. For further explanation of the increase in amortization of purchased intangible assets, see
“Amortization of Purchased Intangible Assets” below.
These amounts were partially offset by productivity benefits and the absence of charges related to the TiVo patent litigation
settlement which we incurred in the fourth quarter of fiscal 2013. The productivity benefits we experienced in fiscal 2014 were
driven by value engineering efforts; favorable component pricing; and continued operational efficiency in manufacturing
operations.
Service Gross Margin
Fiscal 2015 Compared with Fiscal 2014
Service gross margin percentage decreased by 2.0 percentage points for fiscal 2015, as compared with fiscal 2014, driven by
increased cost impacts such as partner delivery costs, headcount-related costs and outside services. Headcount-related costs
increased due to continued investments in security and cloud managed services and higher variable compensation expense. These
cost impacts were partially offset by the resulting benefit to gross margin of higher sales volume in both advanced services and
technical support services.
Our service gross margin normally experiences some fluctuations due to various factors such as the timing of contract initiations
in our renewals, our strategic investments in headcount, and the resources we deploy to support the overall service business.
Other factors include the mix of service offerings, as the gross margin from our advanced services is typically lower than the
gross margin from technical support services.
Fiscal 2014 Compared with Fiscal 2013
Our service gross margin percentage increased slightly by 0.3 percentage points for fiscal 2014, as compared with fiscal 2013.
The increase was primarily due to higher sales volume in both advanced services and technical support services. The benefits to
gross margin of increased sales volume were partially offset by increased cost impacts such as outside service costs, partner
delivery costs, and headcount-related costs.
52