Cisco 2015 Annual Report Download - page 65
Download and view the complete annual report
Please find page 65 of the 2015 Cisco annual report below. You can navigate through the pages in the report by either clicking on the pages listed below, or by using the keyword search tool below to find specific information within the annual report.-
 1
1 -
2
-
3
-
4
-
5
-
6
-
7
-
8
-
9
-
10
-
11
-
12
-
13
-
14
-
15
-
16
-
17
-
18
-
19
-
20
-
21
-
22
-
23
-
24
-
25
-
26
-
27
-
28
-
29
-
30
-
31
-
32
-
33
-
34
-
35
-
36
-
37
-
38
-
39
-
40
-
41
-
42
-
43
-
44
-
45
-
46
-
47
-
48
-
49
-
50
-
51
-
52
-
53
-
54
-
 55
55 -
 56
56 -
 57
57 -
 58
58 -
 59
59 -
 60
60 -
 61
61 -
 62
62 -
 63
63 -
 64
64 -
 65
65 -
 66
66 -
 67
67 -
 68
68 -
 69
69 -
 70
70 -
 71
71 -
 72
72 -
 73
73 -
 74
74 -
 75
75 -
76
-
77
-
78
-
79
-
80
-
81
-
82
-
83
-
84
-
85
-
86
-
87
-
88
-
89
-
90
-
91
-
92
-
93
-
94
-
95
-
96
-
97
-
98
-
99
-
100
-
101
-
102
-
103
-
104
-
105
-
106
-
107
-
108
-
109
-
110
-
111
-
112
-
113
-
114
-
115
-
116
-
117
-
118
-
119
-
120
-
121
-
122
-
123
-
124
-
125
-
126
-
127
-
128
-
129
-
130
-
131
-
132
-
133
-
134
-
135
-
136
-
137
-
138
-
139
-
140
 |
 |

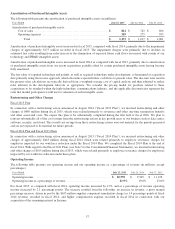
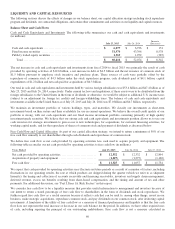
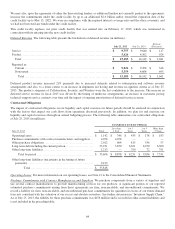
Amortization of Purchased Intangible Assets
The following table presents the amortization of purchased intangible assets (in millions):
Years Ended July 25, 2015 July 26, 2014 July 27, 2013
Amortization of purchased intangible assets:
Cost of sales ............................................................... $ 814 $ 742 $ 606
Operating expenses ........................................................ 359 275 395
Total ................................................................. $ 1,173 $ 1,017 $ 1,001
Amortization of purchased intangible assets increased in fiscal 2015, compared with fiscal 2014, primarily due to the impairment
charges of approximately $175 million recorded in fiscal 2015. The impairment charges were primarily due to declines in
estimated fair value resulting from reductions in or the elimination of expected future cash flows associated with certain of our
technology and IPR&D intangible assets.
Amortization of purchased intangible assets increased in fiscal 2014 as compared with fiscal 2013, primarily due to amortization
of purchased intangible assets from our recent acquisitions partially offset by certain purchased intangible assets having become
fully amortized.
The fair value of acquired technology and patents, as well as acquired technology under development, is determined at acquisition
date primarily using the income approach, which discounts expected future cash flows to present value. The discount rates used in
the present value calculations are typically derived from a weighted-average cost of capital analysis and then adjusted to reflect
risks inherent in the development lifecycle as appropriate. We consider the pricing model for products related to these
acquisitions to be standard within the high-technology communications industry, and the applicable discount rates represent the
rates that market participants would use for valuation of such intangible assets.
Restructuring and Other Charges
Fiscal 2015 Plan
In connection with a restructuring action announced in August 2014 (“Fiscal 2015 Plan”), we incurred restructuring and other
charges of $489 million during fiscal 2015, which were related primarily to severance and other one-time termination benefits
and other associated costs. We expect this plan to be substantially completed during the first half of fiscal 2016. We plan to
reinvest substantially all of the cost savings from the restructuring actions in key growth areas of our business such as data center,
software, security, and cloud. The overall cost savings from these restructuring actions were not material for the periods presented
and are not expected to be material for future periods.
Fiscal 2014 Plan and Fiscal 2011 Plans
In connection with a restructuring action announced in August 2013 (“Fiscal 2014 Plan”), we incurred restructuring and other
charges of approximately $418 million during fiscal 2014 which were related primarily to employee severance charges for
employees impacted by our workforce reduction under the Fiscal 2014 Plan. We completed the Fiscal 2014 Plan at the end of
fiscal 2014. With regard to the Fiscal 2011 Plans (see Note 5 to the Consolidated Financial Statements), we incurred restructuring
and other charges of $105 million during fiscal 2013, which were related primarily to employee severance charges for employees
impacted by our workforce reduction under these plans.
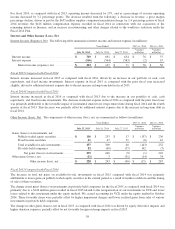
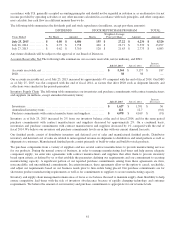
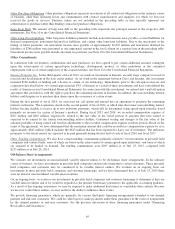
Operating Income
The following table presents our operating income and our operating income as a percentage of revenue (in millions, except
percentages):
Years Ended July 25, 2015 July 26, 2014 July 27, 2013
Operating income ................................................................ $ 10,770 $ 9,345 $ 11,196
Operating income as a percentage of revenue ..................................... 21.9% 19.8% 23.0%
For fiscal 2015, as compared with fiscal 2014, operating income increased by 15%, and as a percentage of revenue operating
income increased by 2.1 percentage points. The increase resulted from the following: an increase in revenue; a gross margin
percentage increase, driven in part by the $655 million supplier component remediation charge (or 1.4 percentage points of fiscal
2014 revenue) recorded in fiscal 2014; and higher compensation expense recorded in fiscal 2014 in connection with our
acquisition of the remaining interest in Insieme.
57