Cisco 2015 Annual Report Download - page 46
Download and view the complete annual report
Please find page 46 of the 2015 Cisco annual report below. You can navigate through the pages in the report by either clicking on the pages listed below, or by using the keyword search tool below to find specific information within the annual report.-
 1
1 -
2
-
3
-
4
-
5
-
6
-
7
-
8
-
9
-
10
-
11
-
12
-
13
-
14
-
15
-
16
-
17
-
18
-
19
-
20
-
21
-
22
-
23
-
24
-
25
-
26
-
27
-
28
-
29
-
30
-
31
-
32
-
33
-
34
-
35
-
 36
36 -
 37
37 -
 38
38 -
 39
39 -
 40
40 -
 41
41 -
 42
42 -
 43
43 -
 44
44 -
 45
45 -
 46
46 -
 47
47 -
 48
48 -
 49
49 -
 50
50 -
 51
51 -
 52
52 -
 53
53 -
 54
54 -
 55
55 -
 56
56 -
57
-
58
-
59
-
60
-
61
-
62
-
63
-
64
-
65
-
66
-
67
-
68
-
69
-
70
-
71
-
72
-
73
-
74
-
75
-
76
-
77
-
78
-
79
-
80
-
81
-
82
-
83
-
84
-
85
-
86
-
87
-
88
-
89
-
90
-
91
-
92
-
93
-
94
-
95
-
96
-
97
-
98
-
99
-
100
-
101
-
102
-
103
-
104
-
105
-
106
-
107
-
108
-
109
-
110
-
111
-
112
-
113
-
114
-
115
-
116
-
117
-
118
-
119
-
120
-
121
-
122
-
123
-
124
-
125
-
126
-
127
-
128
-
129
-
130
-
131
-
132
-
133
-
134
-
135
-
136
-
137
-
138
-
139
-
140
 |
 |

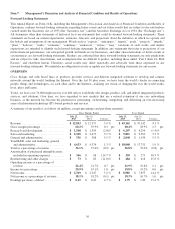
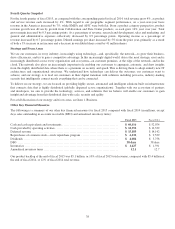
Fourth Quarter Snapshot
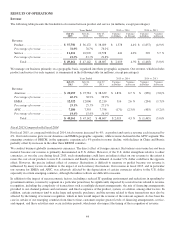
For the fourth quarter of fiscal 2015, as compared with the corresponding period in fiscal 2014, total revenue grew 4%, as product
and service revenue each increased by 4%. With regard to our geographic segment performance, on a year-over-year basis
revenue in the Americas increased by 7%, while EMEA and APJC were both flat. From a product category perspective, product
revenue growth was driven by growth from Collaboration and Data Center products, as each grew 14% year over year. Total
gross margin increased by 0.3 percentage points. As a percentage of revenue, research and development, sales and marketing, and
general and administrative expenses collectively decreased by 0.9 percentage points. Operating income as a percentage of
revenue increased by 0.7 percentage points. Diluted earnings per share increased by 5% from the prior year, primarily as a result
of both a 3% increase in net income and a decrease in our diluted share count by 41 million shares.
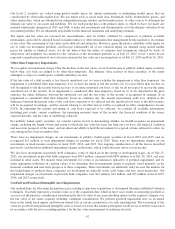
Strategy and Focus Areas
We see our customers, in every industry, increasingly using technology—and, specifically, the network—to grow their business,
drive efficiencies, and try to gain a competitive advantage. In this increasingly digital world, data is the most strategic asset and is
increasingly distributed across every organization and ecosystem—on customer premises, at the edge of the network, and in the
cloud. The network also plays an increasingly important role enabling our customers to aggregate, automate, and draw insights
from this highly distributed data where there is a premium on security and speed. This is driving them to adopt entirely new IT
architectures and organizational structures. We understand how technology can deliver the outcomes our customers want to
achieve, and our strategy is to lead our customers in their digital transition with solutions including pervasive, industry-leading
security that intelligently connect nearly everything that can be connected.
To deliver on our strategy, we are focused on providing highly secure, automated and intelligent solutions built on infrastructure
that connects data that is highly distributed (globally dispersed across organizations). Together with our ecosystem of partners
and developers, we aim to provide the technology, services, and solutions that we believe will enable our customers to gain
insight and advantage from this distributed data with scale, security and agility.
For a full discussion of our strategy and focus areas, see Item 1. Business.
Other Key Financial Measures
The following is a summary of our other key financial measures for fiscal 2015 compared with fiscal 2014 (in millions, except
days sales outstanding in accounts receivable (DSO) and annualized inventory turns):
Fiscal 2015 Fiscal 2014
Cash and cash equivalents and investments ............................................... $ 60,416 $ 52,074
Cash provided by operating activities ..................................................... $ 12,552 $ 12,332
Deferred revenue ......................................................................... $ 15,183 $ 14,142
Repurchases of common stock—stock repurchase program ............................... $ 4,234 $ 9,539
Dividends ................................................................................ $ 4,086 $ 3,758
DSO ..................................................................................... 38 days 38 days
Inventories ............................................................................... $ 1,627 $ 1,591
Annualized inventory turns ............................................................... 12.1 12.7
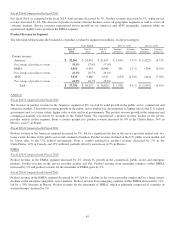
Our product backlog at the end of fiscal 2015 was $5.1 billion, or 10% of fiscal 2015 total revenue, compared with $5.4 billion at
the end of fiscal 2014, or 12% of fiscal 2014 total revenue.
38