Cisco 2015 Annual Report Download - page 66
Download and view the complete annual report
Please find page 66 of the 2015 Cisco annual report below. You can navigate through the pages in the report by either clicking on the pages listed below, or by using the keyword search tool below to find specific information within the annual report.
For fiscal 2014, as compared with fiscal 2013, operating income decreased by 17%, and as a percentage of revenue operating
income decreased by 3.2 percentage points. The decrease resulted from the following: a decrease in revenue; a gross margin
percentage decline, driven in part by the $655 million supplier component remediation charge (or 1.4 percentage points of fiscal
2014 revenue); the $416 million compensation expense recorded in fiscal 2014 in connection with our acquisition of the
remaining interest in Insieme; and an increase in restructuring and other charges related to the workforce reduction under the
Fiscal 2014 Plan.
Interest and Other Income (Loss), Net
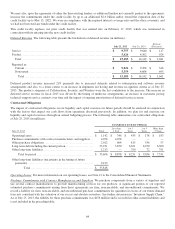
Interest Income (Expense), Net The following table summarizes interest income and interest expense (in millions):
Years Ended 2015 vs. 2014 2014 vs. 2013
July 25, 2015 July 26, 2014 July 27, 2013
Variance
in Dollars
Variance
in Dollars
Interest income .................................... $ 769 $ 691 $ 654 $ 78 $ 37
Interest expense ................................... (566) (564) (583) (2) 19
Interest income (expense), net ................ $ 203 $ 127 $ 71 $ 76 $ 56
Fiscal 2015 Compared with Fiscal 2014
Interest income increased in fiscal 2015 as compared with fiscal 2014, driven by an increase in our portfolio of cash, cash
equivalents, and fixed income investments. Interest expense in fiscal 2015 as compared with the prior fiscal year increased
slightly, driven by additional interest expense due to the net increase in long-term debt in fiscal 2015.
Fiscal 2014 Compared with Fiscal 2013
Interest income increased in fiscal 2014 as compared with fiscal 2013 due to the increase in our portfolio of cash, cash
equivalents, and fixed income investments. The decrease in interest expense in fiscal 2014 as compared with the prior fiscal year
was primarily attributable to the favorable impact of incremental interest rate swaps entered into during fiscal 2014 and the fourth
quarter of fiscal 2013. This decrease was partially offset by additional interest expense due to the increase in long-term debt in
fiscal 2014.
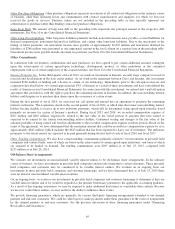
Other Income (Loss), Net The components of other income (loss), net, are summarized as follows (in millions):
Years Ended 2015 vs. 2014 2014 vs. 2013
July 25, 2015 July 26, 2014 July 27, 2013
Variance
in Dollars
Variance
in Dollars
Gains (losses) on investments, net:
Publicly traded equity securities .............. $ 116 $ 253 $ 17 $ (137) $ 236
Fixed income securities ...................... 41 47 31 (6) 16
Total available-for-sale investments .......... 157 300 48 (143) 252
Privately held companies ..................... 82 (60) (57) 142 (3)
Net gains (losses) on investments ........ 239 240 (9) (1) 249
Other gains (losses), net ........................... (11) 3 (31) (14) 34
Other income (loss), net ............ $ 228 $ 243 $ (40) $ (15) $ 283
Fiscal 2015 Compared with Fiscal 2014
The decrease in total net gains on available-for-sale investments in fiscal 2015 compared with fiscal 2014 was primarily
attributable to lower gains on publicly traded equity securities in the current period as a result of market conditions and the timing
of sales of these securities.
The change in net gains (losses) on investments in privately held companies for the fiscal 2015 as compared with fiscal 2014 was
primarily due to a $126 million gain recorded in fiscal 2015 related to the reorganization of our investments in VCE and lower
losses related to this investment under the equity method. We ceased accounting for VCE under the equity method in October
2014. These favorable items were partially offset by higher impairment charges and lower realized gains from sales of various
investments in privately held companies.
The change in other gains (losses), net in fiscal 2015 as compared with fiscal 2014 was driven by equity derivative impacts and
higher donation expenses, partially offset by net favorable foreign exchange impacts in fiscal 2015.
58


