Cisco 2015 Annual Report Download - page 53
Download and view the complete annual report
Please find page 53 of the 2015 Cisco annual report below. You can navigate through the pages in the report by either clicking on the pages listed below, or by using the keyword search tool below to find specific information within the annual report.-
 1
1 -
2
-
3
-
4
-
5
-
6
-
7
-
8
-
9
-
10
-
11
-
12
-
13
-
14
-
15
-
16
-
17
-
18
-
19
-
20
-
21
-
22
-
23
-
24
-
25
-
26
-
27
-
28
-
29
-
30
-
31
-
32
-
33
-
34
-
35
-
36
-
37
-
38
-
39
-
40
-
41
-
42
-
 43
43 -
 44
44 -
 45
45 -
 46
46 -
 47
47 -
 48
48 -
 49
49 -
 50
50 -
 51
51 -
 52
52 -
 53
53 -
 54
54 -
 55
55 -
 56
56 -
 57
57 -
 58
58 -
 59
59 -
 60
60 -
 61
61 -
 62
62 -
 63
63 -
64
-
65
-
66
-
67
-
68
-
69
-
70
-
71
-
72
-
73
-
74
-
75
-
76
-
77
-
78
-
79
-
80
-
81
-
82
-
83
-
84
-
85
-
86
-
87
-
88
-
89
-
90
-
91
-
92
-
93
-
94
-
95
-
96
-
97
-
98
-
99
-
100
-
101
-
102
-
103
-
104
-
105
-
106
-
107
-
108
-
109
-
110
-
111
-
112
-
113
-
114
-
115
-
116
-
117
-
118
-
119
-
120
-
121
-
122
-
123
-
124
-
125
-
126
-
127
-
128
-
129
-
130
-
131
-
132
-
133
-
134
-
135
-
136
-
137
-
138
-
139
-
140
 |
 |

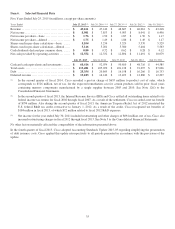
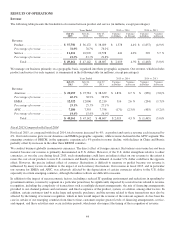
Fiscal 2014 Compared with Fiscal 2013
For fiscal 2014, as compared with fiscal 2013, total revenue decreased by 3%. Product revenue decreased by 5%, while service
revenue increased by 4%. The decrease in product revenue reflected declines across all geographic segments as well as across all
customer markets. Service revenues experienced slower growth in our Americas and APJC geographic segments while we
experienced slightly faster growth in the EMEA segment.
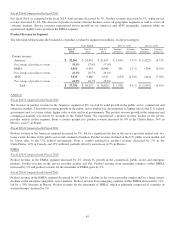
Product Revenue by Segment
The following table presents the breakdown of product revenue by segment (in millions, except percentages):
Years Ended 2015 vs. 2014 2014 vs. 2013
July 25,
2015
July 26,
2014
July 27,
2013
Variance
in Dollars
Variance
in Percent
Variance
in Dollars
Variance
in Percent
Product revenue:
Americas .............................. $ 22,261 $ 20,631 $ 21,653 $ 1,630 7.9 % $ (1,022) (4.7)%
Percentage of product revenue ........ 59.0% 57.0% 57.0%
EMEA ................................ 9,856 9,655 10,049 201 2.1 % (394) (3.9)%
Percentage of product revenue ........ 26.1% 26.7% 26.4%
APJC ................................. 5,633 5,886 6,327 (253) (4.3)% (441) (7.0)%
Percentage of product revenue ........ 14.9% 16.3% 16.6%
Total .............................. $ 37,750 $ 36,172 $ 38,029 $ 1,578 4.4 % $ (1,857) (4.9)%
Americas
Fiscal 2015 Compared with Fiscal 2014
The increase in product revenue in the Americas segment of 8% was led by solid growth in the public sector, commercial and
enterprise markets. The product revenue growth in the public sector market was due primarily to higher sales to the U.S. federal
government and, to a lesser extent, higher sales to state and local governments. The product revenue growth in the enterprise and
commercial markets was driven by strength in the United States. We experienced a product revenue decline in the service
provider market in this segment. From a country perspective, product revenue increased by 8% in the United States, 34% in
Mexico, and 2% in Brazil.
Fiscal 2014 Compared with Fiscal 2013
Product revenue in the Americas segment decreased by 5%, led by a significant decline in the service provider market and, to a
lesser extent, declines in the public sector and commercial markets. Product revenue declined in the U.S. public sector market, led
by lower sales to the U.S. federal government. From a country perspective, product revenue decreased by 5% in the
United States, 10% in Canada, and 13% in Brazil, partially offset by an increase of 2% in Mexico.
EMEA
Fiscal 2015 Compared with Fiscal 2014
Product revenue in the EMEA segment increased by 2%, driven by growth in the commercial, public sector and enterprise
markets. Product revenue in the service provider market was flat. Product revenue from emerging countries within EMEA
increased by 1% and product revenue for the remainder of EMEA grew by 2%.
Fiscal 2014 Compared with Fiscal 2013
Product revenue in the EMEA segment decreased by 4%, led by a decline in the service provider market and, to a lesser extent,
declines in the enterprise and public sector markets. Product revenue from emerging countries within EMEA decreased by 11%,
led by a 24% decrease in Russia. Product revenue for the remainder of EMEA, which is primarily composed of countries in
western Europe, declined by 2%.
45