Cisco 2015 Annual Report Download - page 45
Download and view the complete annual report
Please find page 45 of the 2015 Cisco annual report below. You can navigate through the pages in the report by either clicking on the pages listed below, or by using the keyword search tool below to find specific information within the annual report.-
 1
1 -
2
-
3
-
4
-
5
-
6
-
7
-
8
-
9
-
10
-
11
-
12
-
13
-
14
-
15
-
16
-
17
-
18
-
19
-
20
-
21
-
22
-
23
-
24
-
25
-
26
-
27
-
28
-
29
-
30
-
31
-
32
-
33
-
34
-
 35
35 -
 36
36 -
 37
37 -
 38
38 -
 39
39 -
 40
40 -
 41
41 -
 42
42 -
 43
43 -
 44
44 -
 45
45 -
 46
46 -
 47
47 -
 48
48 -
 49
49 -
 50
50 -
 51
51 -
 52
52 -
 53
53 -
 54
54 -
 55
55 -
56
-
57
-
58
-
59
-
60
-
61
-
62
-
63
-
64
-
65
-
66
-
67
-
68
-
69
-
70
-
71
-
72
-
73
-
74
-
75
-
76
-
77
-
78
-
79
-
80
-
81
-
82
-
83
-
84
-
85
-
86
-
87
-
88
-
89
-
90
-
91
-
92
-
93
-
94
-
95
-
96
-
97
-
98
-
99
-
100
-
101
-
102
-
103
-
104
-
105
-
106
-
107
-
108
-
109
-
110
-
111
-
112
-
113
-
114
-
115
-
116
-
117
-
118
-
119
-
120
-
121
-
122
-
123
-
124
-
125
-
126
-
127
-
128
-
129
-
130
-
131
-
132
-
133
-
134
-
135
-
136
-
137
-
138
-
139
-
140
 |
 |
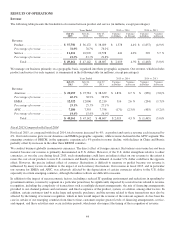
Fiscal 2015 Compared with Fiscal 2014—Financial Performance
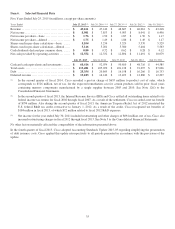
Total revenue increased by 4% as compared with fiscal 2014, with product and service revenue each increasing by 4%. Total
gross margin increased by 1.5 percentage points, as we experienced stable gross margins and the absence in fiscal 2015 of a $655
million supplier component remediation charge recorded in fiscal 2014. As a percentage of revenue, research and development,
sales and marketing, and general and administrative expenses, collectively, decreased by 0.8 percentage points, primarily as a
result of higher acquisition-related compensation expense in fiscal 2014. Operating income as a percentage of revenue increased
by 2.1 percentage points. Diluted earnings per share increased by 17% from the prior year, as a result of both a 14% increase in
net income and a decrease in diluted share count by 135 million shares.
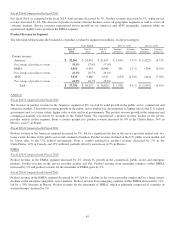
In fiscal 2015, revenue increased by $2.0 billion as compared with fiscal 2014. Revenue from the Americas increased by $1.9
billion, driven in large part by higher product revenue in the United States. EMEA revenue increased $0.3 billion, led by higher
product revenue in the United Kingdom. Revenue in our APJC segment decreased $0.2 billion, led by a product revenue decline
in China. We experienced decreased product revenue in the emerging countries of China and Russia and increased revenue in
Mexico, India and Brazil, as the “BRICM” countries experienced, in the aggregate, a product revenue decline of 4%. We believe
that the product revenue declines we experienced in various emerging countries reflected the impact of economic and geopolitical
challenges in those countries.
From a customer market standpoint, in fiscal 2015 we experienced solid product revenue growth in the commercial, public sector
and enterprise markets, while the service provider market continued to decline. The decline in service provider market was driven
by the product revenue decline in our Service Provider Video category.
From a product category perspective, the product revenue increase of 4% year-over-year was driven in part by product revenue
growth in our core Switching and NGN Routing products which grew 5% and 1%, respectively. We also experienced an increase
in revenue from Data Center and Security products which grew 22% and 12%, respectively. Our other major product categories
experienced revenue growth with the exception of Service Provider Video which decreased by 10%. Our deferred product
revenue grew 21% year-over-year driven by subscription and software revenue arrangements, with strength in Collaboration,
Security and Wireless. Service revenue increased by 4% year over year.
In summary, during fiscal 2015, we achieved solid and profitable revenue growth despite encountering challenges similar to those
we experienced during fiscal 2014 in the service provider market and certain emerging countries.
37