Cisco 2015 Annual Report Download - page 96
Download and view the complete annual report
Please find page 96 of the 2015 Cisco annual report below. You can navigate through the pages in the report by either clicking on the pages listed below, or by using the keyword search tool below to find specific information within the annual report.
4. Goodwill and Purchased Intangible Assets
(a) Goodwill
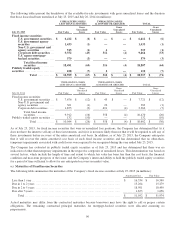
The following tables present the goodwill allocated to the Company’s reportable segments as of July 25, 2015 and July 26, 2014,
as well as the changes to goodwill during fiscal 2015 and 2014 (in millions):
Balance at
July 26, 2014 Acquisitions Other
Balance at
July 25, 2015
Americas .................................................... $ 15,080 $ 145 $ (13) $ 15,212
EMEA ...................................................... 5,715 84 (8) 5,791
APJC ....................................................... 3,444 26 (4) 3,466
Total .................................................... $ 24,239 $ 255 $ (25) $ 24,469
Balance at
July 27, 2013 Acquisitions Other
Balance at
July 26, 2014
Americas .................................................... $ 13,800 $ 1,275 $ 5 $ 15,080
EMEA ....................................................... 5,037 681 (3) 5,715
APJC ........................................................ 3,082 362 — 3,444
Total ..................................................... $ 21,919 $ 2,318 $ 2 $ 24,239
“Other” in the tables above primarily consists of purchase accounting adjustments.
(b) Purchased Intangible Assets
The following tables present details of the Company’s intangible assets acquired through business combinations completed
during fiscal 2015 and 2014 (in millions, except years):
FINITE LIVES
INDEFINITE
LIVES
TECHNOLOGY
CUSTOMER
RELATIONSHIPS OTHER IPR&D TOTAL
Fiscal 2015
Weighted-
Average Useful
Life (in Years) Amount
Weighted-
Average Useful
Life (in Years) Amount
Weighted-
Average Useful
Life (in Years) Amount Amount Amount
Metacloud ................. 3.0 $ 24 5.0 $ 3 0.0 $ — $ 2 $ 29
All others (five in total) ... 4.7 48 7.8 12 5.8 6 4 70
Total ................... $72 $15 $6$ 6$99
FINITE LIVES
INDEFINITE
LIVES
TOTALTECHNOLOGY
CUSTOMER
RELATIONSHIPS OTHER IPR&D
Fiscal 2014
Weighted-
Average Useful
Life (in Years) Amount
Weighted-
Average Useful
Life (in Years) Amount
Weighted-
Average Useful
Life (in Years) Amount Amount Amount
Composite Software ........ 6.0 $ 60 3.9 $ 14 0.0 $ — $ 1 $ 75
Sourcefire .................. 7.0 400 5.0 129 3.0 26 22 577
WhipTail ................... 5.0 63 5.0 1 2.7 3 38 105
Tail-f ....................... 7.0 55 6.8 6 0.0 — — 61
All others (four in total) .... 3.6 18 4.0 2 0.0 — — 20
Total ................... $ 596 $ 152 $ 29 $ 61 $ 838
88


