Cisco 2015 Annual Report Download - page 102
Download and view the complete annual report
Please find page 102 of the 2015 Cisco annual report below. You can navigate through the pages in the report by either clicking on the pages listed below, or by using the keyword search tool below to find specific information within the annual report.-
 1
1 -
2
-
3
-
4
-
5
-
6
-
7
-
8
-
9
-
10
-
11
-
12
-
13
-
14
-
15
-
16
-
17
-
18
-
19
-
20
-
21
-
22
-
23
-
24
-
25
-
26
-
27
-
28
-
29
-
30
-
31
-
32
-
33
-
34
-
35
-
36
-
37
-
38
-
39
-
40
-
41
-
42
-
43
-
44
-
45
-
46
-
47
-
48
-
49
-
50
-
51
-
52
-
53
-
54
-
55
-
56
-
57
-
58
-
59
-
60
-
61
-
62
-
63
-
64
-
65
-
66
-
67
-
68
-
69
-
70
-
71
-
72
-
73
-
74
-
75
-
76
-
77
-
78
-
79
-
80
-
81
-
82
-
83
-
84
-
85
-
86
-
87
-
88
-
89
-
90
-
91
-
 92
92 -
 93
93 -
 94
94 -
 95
95 -
 96
96 -
 97
97 -
 98
98 -
 99
99 -
 100
100 -
 101
101 -
 102
102 -
 103
103 -
 104
104 -
 105
105 -
 106
106 -
 107
107 -
 108
108 -
 109
109 -
 110
110 -
 111
111 -
 112
112 -
113
-
114
-
115
-
116
-
117
-
118
-
119
-
120
-
121
-
122
-
123
-
124
-
125
-
126
-
127
-
128
-
129
-
130
-
131
-
132
-
133
-
134
-
135
-
136
-
137
-
138
-
139
-
140
 |
 |

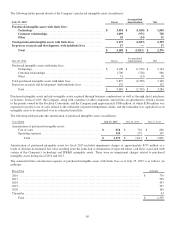
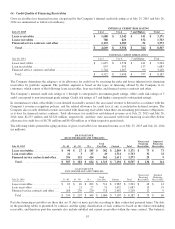
of either unbilled or current financing receivables included in the category of 91 days plus past due for financing receivables were
$496 million and $334 million as of July 25, 2015 and July 26, 2014, respectively.
As of July 25, 2015, the Company had financing receivables of $70 million, net of unbilled or current receivables from the same
contract, that were in the category of 91 days plus past due but remained on accrual status as they are well secured and in the
process of collection. Such balance was $78 million as of July 26, 2014.
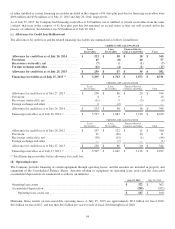
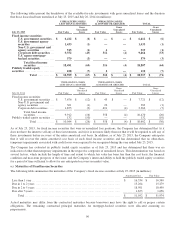
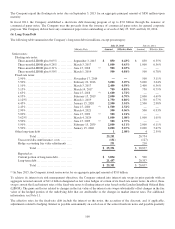
(c) Allowance for Credit Loss Rollforward
The allowances for credit loss and the related financing receivables are summarized as follows (in millions):
CREDIT LOSS ALLOWANCES
Lease
Receivables
Loan
Receivables
Financed Service
Contracts and Other Total
Allowance for credit loss as of July 26, 2014 ......... $ 233 $ 98 $ 18 $ 349
Provisions ............................................. 45 (8) 20 57
Recoveries (write-offs), net ........................... (7) 1 (1) (7)
Foreign exchange and other .......................... (12) (4) (1) (17)
Allowance for credit loss as of July 25, 2015 ......... $ 259 $ 87 $ 36 $ 382
Financing receivables as of July 25, 2015 (1) .......... $ 3,395 $ 1,763 $ 3,573 $ 8,731
CREDIT LOSS ALLOWANCES
Lease
Receivables
Loan
Receivables
Financed Service
Contracts and Other Total
Allowance for credit loss as of July 27, 2013 ........... $ 238 $ 86 $ 20 $ 344
Provisions ............................................. 4 9 1 14
Recoveries (write-offs), net ............................ (11) 5 (3) (9)
Foreign exchange and other ............................ 2 (2) — —
Allowance for credit loss as of July 26, 2014 ........... $ 233 $ 98 $ 18 $ 349
Financing receivables as of July 26, 2014 (1) ............ $ 3,527 $ 1,683 $ 3,210 $ 8,420
CREDIT LOSS ALLOWANCES
Lease
Receivables
Loan
Receivables
Financed Service
Contracts and Other Total
Allowance for credit loss as of July 28, 2012 ........... $ 247 $ 122 $ 11 $ 380
Provisions ............................................. 21 (20) 10 11
Recoveries (write-offs), net ............................ (30) (15) (1) (46)
Foreign exchange and other ............................ — (1) — (1)
Allowance for credit loss as of July 27, 2013 ........... $ 238 $ 86 $ 20 $ 344
Financing receivables as of July 27, 2013 (1) ............ $ 3,507 $ 1,649 $ 3,136 $ 8,292
(1) Total financing receivables before allowance for credit loss.
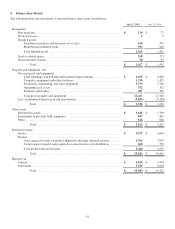
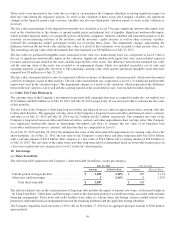
(d) Operating Leases
The Company provides financing of certain equipment through operating leases, and the amounts are included in property and
equipment in the Consolidated Balance Sheets. Amounts relating to equipment on operating lease assets and the associated
accumulated depreciation are summarized as follows (in millions):
July 25, 2015 July 26, 2014
Operating lease assets ....................................................................... $ 372 $ 362
Accumulated depreciation ................................................................... (205) (202)
Operating lease assets, net .............................................................. $ 167 $ 160
Minimum future rentals on non-cancelable operating leases at July 25, 2015 are approximately $0.2 billion for fiscal 2016,
$0.1 billion for fiscal 2017, and less than $0.1 billion per year for each of fiscal 2018 through fiscal 2020.
94