Cisco 2015 Annual Report Download - page 84
Download and view the complete annual report
Please find page 84 of the 2015 Cisco annual report below. You can navigate through the pages in the report by either clicking on the pages listed below, or by using the keyword search tool below to find specific information within the annual report.-
 1
1 -
2
-
3
-
4
-
5
-
6
-
7
-
8
-
9
-
10
-
11
-
12
-
13
-
14
-
15
-
16
-
17
-
18
-
19
-
20
-
21
-
22
-
23
-
24
-
25
-
26
-
27
-
28
-
29
-
30
-
31
-
32
-
33
-
34
-
35
-
36
-
37
-
38
-
39
-
40
-
41
-
42
-
43
-
44
-
45
-
46
-
47
-
48
-
49
-
50
-
51
-
52
-
53
-
54
-
55
-
56
-
57
-
58
-
59
-
60
-
61
-
62
-
63
-
64
-
65
-
66
-
67
-
68
-
69
-
70
-
71
-
72
-
73
-
 74
74 -
 75
75 -
 76
76 -
 77
77 -
 78
78 -
 79
79 -
 80
80 -
 81
81 -
 82
82 -
 83
83 -
 84
84 -
 85
85 -
 86
86 -
 87
87 -
 88
88 -
 89
89 -
 90
90 -
 91
91 -
 92
92 -
 93
93 -
 94
94 -
95
-
96
-
97
-
98
-
99
-
100
-
101
-
102
-
103
-
104
-
105
-
106
-
107
-
108
-
109
-
110
-
111
-
112
-
113
-
114
-
115
-
116
-
117
-
118
-
119
-
120
-
121
-
122
-
123
-
124
-
125
-
126
-
127
-
128
-
129
-
130
-
131
-
132
-
133
-
134
-
135
-
136
-
137
-
138
-
139
-
140
 |
 |

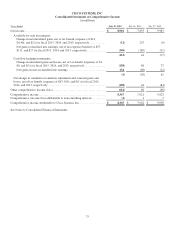
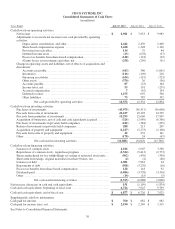
CISCO SYSTEMS, INC.
Consolidated Statements of Cash Flows
(in millions)
Years Ended July 25, 2015 July 26, 2014 July 27, 2013
Cash flows from operating activities:
Net income .................................................................. $ 8,981 $ 7,853 $ 9,983
Adjustments to reconcile net income to net cash provided by operating
activities:
Depreciation, amortization, and other .................................... 2,442 2,439 2,460
Share-based compensation expense ...................................... 1,440 1,348 1,120
Provision for receivables ................................................ 134 79 44
Deferred income taxes .................................................. (23) (678) (37)
Excess tax benefits from share-based compensation ..................... (128) (118) (92)
(Gains) losses on investments and other, net ............................. (258) (299) (91)
Change in operating assets and liabilities, net of effects of acquisitions and
divestitures:
Accounts receivable ..................................................... (413) 340 (1,001)
Inventories .............................................................. (116) (109) 218
Financing receivables ................................................... (634) (119) (723)
Other assets ............................................................. (370) 26 (36)
Accounts payable ....................................................... 87 (23) 164
Income taxes, net ........................................................ 53 191 (239)
Accrued compensation .................................................. 7(42) 134
Deferred revenue ........................................................ 1,275 659 598
Other liabilities ......................................................... 75 785 392
Net cash provided by operating activities ...................... 12,552 12,332 12,894
Cash flows from investing activities:
Purchases of investments ..................................................... (43,975) (36,317) (36,608)
Proceeds from sales of investments ........................................... 20,237 18,193 14,799
Proceeds from maturities of investments ...................................... 15,293 15,660 17,909
Acquisition of businesses, net of cash and cash equivalents acquired .......... (326) (2,989) (6,766)
Purchases of investments in privately held companies ........................ (222) (384) (225)
Return of investments in privately held companies ............................ 288 213 209
Acquisition of property and equipment ....................................... (1,227) (1,275) (1,160)
Proceeds from sales of property and equipment ............................... 22 232 141
Other ........................................................................ (178) 24 (67)
Net cash used in investing activities ........................... (10,088) (6,643) (11,768)
Cash flows from financing activities:
Issuances of common stock .................................................. 2,016 1,907 3,338
Repurchases of common stock - repurchase program ......................... (4,324) (9,413) (2,773)
Shares repurchased for tax withholdings on vesting of restricted stock units . . . (502) (430) (330)
Short-term borrowings, original maturities less than 90 days, net .............. (4) (2) (20)
Issuances of debt ............................................................. 4,981 7,981 24
Repayments of debt .......................................................... (508) (3,276) (16)
Excess tax benefits from share-based compensation .......................... 128 118 92
Dividends paid ............................................................... (4,086) (3,758) (3,310)
Other ........................................................................ (14) (15) (5)
Net cash used in financing activities ........................... (2,313) (6,888) (3,000)
Net increase (decrease) in cash and cash equivalents ............................... 151 (1,199) (1,874)
Cash and cash equivalents, beginning of fiscal year ................................ 6,726 7,925 9,799
Cash and cash equivalents, end of fiscal year ...................................... $ 6,877 $ 6,726 $ 7,925
Supplemental cash flow information:
Cash paid for interest .............................................................. $ 760 $ 682 $ 682
Cash paid for income taxes, net .................................................... $ 2,190 $ 2,349 $ 1,519
See Notes to Consolidated Financial Statements.
76