Cisco 2015 Annual Report Download - page 59
Download and view the complete annual report
Please find page 59 of the 2015 Cisco annual report below. You can navigate through the pages in the report by either clicking on the pages listed below, or by using the keyword search tool below to find specific information within the annual report.-
 1
1 -
2
-
3
-
4
-
5
-
6
-
7
-
8
-
9
-
10
-
11
-
12
-
13
-
14
-
15
-
16
-
17
-
18
-
19
-
20
-
21
-
22
-
23
-
24
-
25
-
26
-
27
-
28
-
29
-
30
-
31
-
32
-
33
-
34
-
35
-
36
-
37
-
38
-
39
-
40
-
41
-
42
-
43
-
44
-
45
-
46
-
47
-
48
-
 49
49 -
 50
50 -
 51
51 -
 52
52 -
 53
53 -
 54
54 -
 55
55 -
 56
56 -
 57
57 -
 58
58 -
 59
59 -
 60
60 -
 61
61 -
 62
62 -
 63
63 -
 64
64 -
 65
65 -
 66
66 -
 67
67 -
 68
68 -
 69
69 -
70
-
71
-
72
-
73
-
74
-
75
-
76
-
77
-
78
-
79
-
80
-
81
-
82
-
83
-
84
-
85
-
86
-
87
-
88
-
89
-
90
-
91
-
92
-
93
-
94
-
95
-
96
-
97
-
98
-
99
-
100
-
101
-
102
-
103
-
104
-
105
-
106
-
107
-
108
-
109
-
110
-
111
-
112
-
113
-
114
-
115
-
116
-
117
-
118
-
119
-
120
-
121
-
122
-
123
-
124
-
125
-
126
-
127
-
128
-
129
-
130
-
131
-
132
-
133
-
134
-
135
-
136
-
137
-
138
-
139
-
140
 |
 |

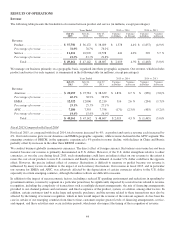
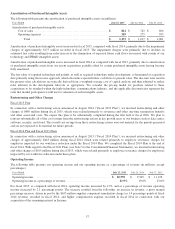
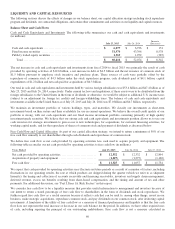
Gross Margin
The following table presents the gross margin for products and services (in millions, except percentages):
AMOUNT PERCENTAGE
Years Ended July 25, 2015 July 26, 2014 July 27, 2013 July 25, 2015 July 26, 2014 July 27, 2013
Gross margin:
Product ...................... $ 22,373 $ 20,531 $ 22,488 59.3% 56.8% 59.1%
Service ...................... 7,308 7,238 6,952 64.0% 66.0% 65.7%
Total .................... $ 29,681 $ 27,769 $ 29,440 60.4% 58.9% 60.6%
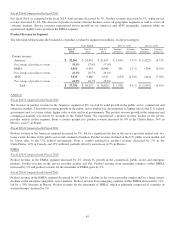
Product Gross Margin
Fiscal 2015 Compared with Fiscal 2014
The following table summarizes the key factors that contributed to the change in product gross margin percentage from fiscal
2014 to fiscal 2015:
Product
Gross Margin
Percentage
Fiscal 2014 ................................................................................................. 56.8 %
Productivity (1) ............................................................................................. 2.8 %
Supplier component remediation charge/adjustment ..................................................... 2.2 %
Mix of products sold ....................................................................................... 0.3 %
Product pricing ............................................................................................ (2.3)%
Rockstar patent portfolio charge .......................................................................... (0.5)%
Fiscal 2015 ................................................................................................. 59.3 %
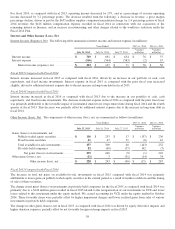
(1) Productivity includes overall manufacturing-related costs, such as component costs, warranty expense, provision for inventory, freight, logistics, shipment
volume, and other items not categorized elsewhere.
Product gross margin increased by 2.5 percentage points compared with fiscal 2014. The increase in product gross margin was
due to productivity improvements, which were driven by value engineering efforts; favorable component pricing; continued
operational efficiency in manufacturing operations and lower warranty expense. Value engineering is the process by which
production costs are reduced through component redesign, board configuration, test processes, and transformation processes. The
increase was also due to the $655 million charge to product cost of sales in fiscal 2014 related to the expected cost to remediate
issues with a supplier component in certain products sold in prior fiscal years and an associated $164 million favorable
adjustment recorded in fiscal 2015.
Additionally, gross margin increased due to the mix of products sold. The favorable product mix impact was due to revenue
decreases from our relatively lower margin Service Provider Video products and a revenue increase from certain of our higher
margin core products, partially offset by increased revenue from our relatively lower margin Cisco Unified Computing System
products. The various factors contributing to the product gross margin increase were partially offset by unfavorable impacts from
product pricing, which were driven by typical market factors and impacted each of our geographic segments and customer
markets, as well as the unfavorable impact of a $188 million charge to product cost of sales recorded in fiscal 2015 related to the
Rockstar patent portfolio, see Note 4(b) to the Consolidated Financial Statements.
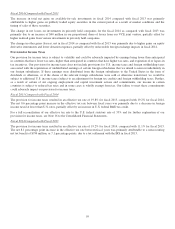
Our future gross margins could be impacted by our product mix and could be adversely affected by further growth in sales of
products that have lower gross margins, such as Cisco Unified Computing System products. Our gross margins may also be
impacted by the geographic mix of our revenue and, as was the case in fiscal 2015, fiscal 2014 and fiscal 2013, may be adversely
affected by product pricing attributable to competitive factors. Additionally, our manufacturing-related costs may be negatively
impacted by constraints in our supply chain, which in turn could negatively affect gross margin. If any of the preceding factors
that in the past have negatively impacted our gross margins arise in future periods, our gross margins could continue to decline.
51