Cisco 2015 Annual Report Download - page 57
Download and view the complete annual report
Please find page 57 of the 2015 Cisco annual report below. You can navigate through the pages in the report by either clicking on the pages listed below, or by using the keyword search tool below to find specific information within the annual report.-
 1
1 -
2
-
3
-
4
-
5
-
6
-
7
-
8
-
9
-
10
-
11
-
12
-
13
-
14
-
15
-
16
-
17
-
18
-
19
-
20
-
21
-
22
-
23
-
24
-
25
-
26
-
27
-
28
-
29
-
30
-
31
-
32
-
33
-
34
-
35
-
36
-
37
-
38
-
39
-
40
-
41
-
42
-
43
-
44
-
45
-
46
-
 47
47 -
 48
48 -
 49
49 -
 50
50 -
 51
51 -
 52
52 -
 53
53 -
 54
54 -
 55
55 -
 56
56 -
 57
57 -
 58
58 -
 59
59 -
 60
60 -
 61
61 -
 62
62 -
 63
63 -
 64
64 -
 65
65 -
 66
66 -
 67
67 -
68
-
69
-
70
-
71
-
72
-
73
-
74
-
75
-
76
-
77
-
78
-
79
-
80
-
81
-
82
-
83
-
84
-
85
-
86
-
87
-
88
-
89
-
90
-
91
-
92
-
93
-
94
-
95
-
96
-
97
-
98
-
99
-
100
-
101
-
102
-
103
-
104
-
105
-
106
-
107
-
108
-
109
-
110
-
111
-
112
-
113
-
114
-
115
-
116
-
117
-
118
-
119
-
120
-
121
-
122
-
123
-
124
-
125
-
126
-
127
-
128
-
129
-
130
-
131
-
132
-
133
-
134
-
135
-
136
-
137
-
138
-
139
-
140
 |
 |

Data Center
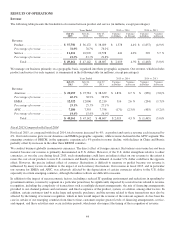
Fiscal 2015 Compared with Fiscal 2014
Revenue in our Data Center product category grew by 22%, or $580 million, with sales growth of our Cisco Unified Computing
System products across all geographic segments and customer markets. The increase was due in large part to the continued
momentum we are experiencing in both data center and cloud environments, as current customers increase their data center build-
outs and as new customers deploy these offerings.
To the extent our data center business grows and further penetrates the market, we expect that, in comparison to what we
experienced during the initial rapid growth of this business, the growth rates for our data center product sales will experience
more normal seasonality consistent with the overall server market.
Fiscal 2014 Compared with Fiscal 2013
We continue to experience solid growth in our Data Center product category, which grew by 27%, or $566 million, with sales
growth of our Cisco Unified Computing System products across all geographic segments and customer markets. The increase was
due in large part to the continued momentum we are experiencing in both data center and cloud environments, as current
customers increase their data center build-outs and as new customers deploy these offerings.
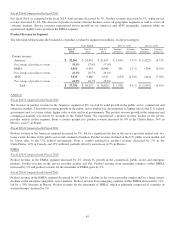
Wireless
Fiscal 2015 Compared with Fiscal 2014
Revenue in our Wireless product category increased by 11%, or $249 million, driven by continued growth in sales of Meraki
products combined with continued strength in our 802.11ac portfolio. We continue to increase the amount of deferred revenue
and the proportion of recurring revenue related to our Wireless product category.
Fiscal 2014 Compared with Fiscal 2013
We continue to increase the proportion of recurring revenue in our Wireless product category. Revenue in our Wireless product
category increased by 2%, or $36 million, due to an increase in sales of Meraki products, which we acquired in the second quarter
of fiscal 2013, partially offset by lower sales of other wireless products.
Security
Fiscal 2015 Compared with Fiscal 2014
Revenue in our Security product category was up 12%, or $181 million, driven primarily by sales of Sourcefire products and, to a
lesser extent, by higher sales of our high-end firewall products within our network security product portfolio. This increase was
partially offset by a slight decrease in revenue from our content security products due to lower sales of web and e-mail security
products. We continue to increase the amount of deferred revenue and the proportion of recurring revenue related to our Security
product category.
Fiscal 2014 Compared with Fiscal 2013
We continue to increase the proportion of recurring revenue in our Security product category. Revenue in our Security product
category was up 16%, or $218 million, driven primarily by sales of Sourcefire products, which company we acquired in the first
quarter of fiscal 2014 and, to a lesser degree, by both higher sales of our high-end firewall products within our network security
product portfolio and slightly higher sales of our content security products.
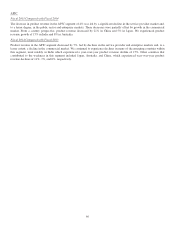
Other Products
We experienced a year-over-year decrease in revenue in our Other Products category for fiscal 2015 due in large part to the
decrease in sales of our other networking products. The year-over-year decrease in revenue in our Other Products category for
fiscal 2014 was due in large part to the sale of our Linksys product line in the third quarter of fiscal 2013.
49