Cisco 2015 Annual Report Download - page 67
Download and view the complete annual report
Please find page 67 of the 2015 Cisco annual report below. You can navigate through the pages in the report by either clicking on the pages listed below, or by using the keyword search tool below to find specific information within the annual report.-
 1
1 -
2
-
3
-
4
-
5
-
6
-
7
-
8
-
9
-
10
-
11
-
12
-
13
-
14
-
15
-
16
-
17
-
18
-
19
-
20
-
21
-
22
-
23
-
24
-
25
-
26
-
27
-
28
-
29
-
30
-
31
-
32
-
33
-
34
-
35
-
36
-
37
-
38
-
39
-
40
-
41
-
42
-
43
-
44
-
45
-
46
-
47
-
48
-
49
-
50
-
51
-
52
-
53
-
54
-
55
-
56
-
 57
57 -
 58
58 -
 59
59 -
 60
60 -
 61
61 -
 62
62 -
 63
63 -
 64
64 -
 65
65 -
 66
66 -
 67
67 -
 68
68 -
 69
69 -
 70
70 -
 71
71 -
 72
72 -
 73
73 -
 74
74 -
 75
75 -
 76
76 -
 77
77 -
78
-
79
-
80
-
81
-
82
-
83
-
84
-
85
-
86
-
87
-
88
-
89
-
90
-
91
-
92
-
93
-
94
-
95
-
96
-
97
-
98
-
99
-
100
-
101
-
102
-
103
-
104
-
105
-
106
-
107
-
108
-
109
-
110
-
111
-
112
-
113
-
114
-
115
-
116
-
117
-
118
-
119
-
120
-
121
-
122
-
123
-
124
-
125
-
126
-
127
-
128
-
129
-
130
-
131
-
132
-
133
-
134
-
135
-
136
-
137
-
138
-
139
-
140
 |
 |

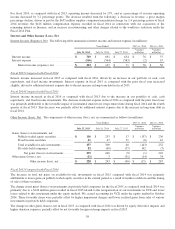
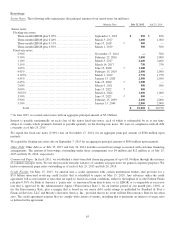
Fiscal 2014 Compared with Fiscal 2013
The increase in total net gains on available-for-sale investments in fiscal 2014 compared with fiscal 2013 was primarily
attributable to higher gains on publicly traded equity securities in the current period as a result of market conditions and the
timing of sales of these securities.
The change in net losses on investments in privately held companies for the fiscal 2014 as compared with fiscal 2013 was
primarily due to an increase of $40 million in our proportional share of losses from our VCE joint venture, partially offset by
higher realized gains from various investments in privately held companies.
The change in other gains (losses), net in fiscal 2014 as compared with fiscal 2013 was primarily due to higher gains on equity
derivative instruments and lower donation expenses, partially offset by unfavorable foreign exchange impacts in fiscal 2014.
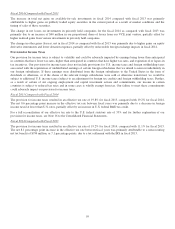
Provision for Income Taxes
Our provision for income taxes is subject to volatility and could be adversely impacted by earnings being lower than anticipated
in countries that have lower tax rates, higher than anticipated in countries that have higher tax rates, and expiration of or lapses in
tax incentives. Our provision for income taxes does not include provisions for U.S. income taxes and foreign withholding taxes
associated with the repatriation of undistributed earnings of certain foreign subsidiaries that we intend to reinvest indefinitely in
our foreign subsidiaries. If these earnings were distributed from the foreign subsidiaries to the United States in the form of
dividends or otherwise, or if the shares of the relevant foreign subsidiaries were sold or otherwise transferred, we would be
subject to additional U.S. income taxes (subject to an adjustment for foreign tax credits) and foreign withholding taxes. Further,
as a result of certain of our ongoing employment and capital investment actions and commitments, our income in certain
countries is subject to reduced tax rates and in some cases is wholly exempt from tax. Our failure to meet these commitments
could adversely impact our provision for income taxes.
Fiscal 2015 Compared with Fiscal 2014
The provision for income taxes resulted in an effective tax rate of 19.8% for fiscal 2015, compared with 19.2% for fiscal 2014.
The net 0.6 percentage point increase in the effective tax rate between fiscal years was primarily due to a decrease in foreign
income taxed at lower than U.S. rates, partially offset by an increase in U.S. federal R&D tax credit.
For a full reconciliation of our effective tax rate to the U.S. federal statutory rate of 35% and for further explanation of our
provision for income taxes, see Note 16 to the Consolidated Financial Statements.
Fiscal 2014 Compared with Fiscal 2013
The provision for income taxes resulted in an effective tax rate of 19.2% for fiscal 2014, compared with 11.1% for fiscal 2013.
The net 8.1 percentage point increase in the effective tax rate between fiscal years was primarily attributable to a non-recurring
net tax benefit of $794 million, or 7.1 percentage points, due to a tax settlement with the IRS in fiscal 2013.
59