Cisco 2015 Annual Report Download - page 72
Download and view the complete annual report
Please find page 72 of the 2015 Cisco annual report below. You can navigate through the pages in the report by either clicking on the pages listed below, or by using the keyword search tool below to find specific information within the annual report.-
 1
1 -
2
-
3
-
4
-
5
-
6
-
7
-
8
-
9
-
10
-
11
-
12
-
13
-
14
-
15
-
16
-
17
-
18
-
19
-
20
-
21
-
22
-
23
-
24
-
25
-
26
-
27
-
28
-
29
-
30
-
31
-
32
-
33
-
34
-
35
-
36
-
37
-
38
-
39
-
40
-
41
-
42
-
43
-
44
-
45
-
46
-
47
-
48
-
49
-
50
-
51
-
52
-
53
-
54
-
55
-
56
-
57
-
58
-
59
-
60
-
61
-
 62
62 -
 63
63 -
 64
64 -
 65
65 -
 66
66 -
 67
67 -
 68
68 -
 69
69 -
 70
70 -
 71
71 -
 72
72 -
 73
73 -
 74
74 -
 75
75 -
 76
76 -
 77
77 -
 78
78 -
 79
79 -
 80
80 -
 81
81 -
 82
82 -
83
-
84
-
85
-
86
-
87
-
88
-
89
-
90
-
91
-
92
-
93
-
94
-
95
-
96
-
97
-
98
-
99
-
100
-
101
-
102
-
103
-
104
-
105
-
106
-
107
-
108
-
109
-
110
-
111
-
112
-
113
-
114
-
115
-
116
-
117
-
118
-
119
-
120
-
121
-
122
-
123
-
124
-
125
-
126
-
127
-
128
-
129
-
130
-
131
-
132
-
133
-
134
-
135
-
136
-
137
-
138
-
139
-
140
 |
 |

We may also, upon the agreement of either the then-existing lenders or additional lenders not currently parties to the agreement,
increase the commitments under the credit facility by up to an additional $2.0 billion and/or extend the expiration date of the
credit facility up to May 15, 2022. We were in compliance with the required interest coverage ratio and the other covenants, and
we had not borrowed any funds under the credit facility.
This credit facility replaces our prior credit facility that was entered into on February 17, 2012, which was terminated in
connection with its entering into the new credit facility.
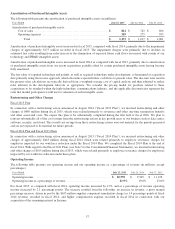
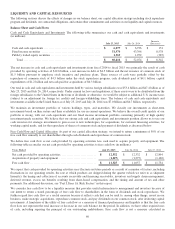
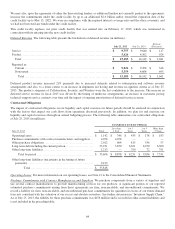
Deferred Revenue The following table presents the breakdown of deferred revenue (in millions):
July 25, 2015 July 26, 2014
Increase
(Decrease)
Service ............................................................................ $ 9,757 $ 9,640 $ 117
Product ........................................................................... 5,426 4,502 924
Total ........................................................................... $ 15,183 $ 14,142 $ 1,041
Reported as:
Current ......................................................................... $ 9,824 $ 9,478 $ 346
Noncurrent ..................................................................... 5,359 4,664 695
Total ......................................................................... $ 15,183 $ 14,142 $ 1,041
Deferred product revenue increased 21% primarily due to increased deferrals related to subscription and software revenue
arrangements and also, to a lesser extent, to an increase in shipments not having met revenue recognition criteria as of July 25,
2015. The product categories of Collaboration, Security, and Wireless were the key contributors to the increase. The increase in
deferred service revenue in fiscal 2015 was driven by the timing of multiyear arrangements, an increase in customers paying
technical support service contracts over time and the impact of ongoing amortization of deferred service revenue.
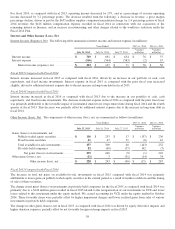
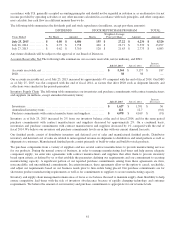
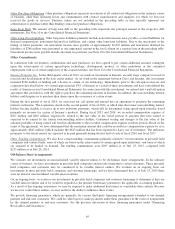
Contractual Obligations
The impact of contractual obligations on our liquidity and capital resources in future periods should be analyzed in conjunction
with the factors that impact our cash flows from operations discussed previously. In addition, we plan for and measure our
liquidity and capital resources through an annual budgeting process. The following table summarizes our contractual obligations
at July 25, 2015 (in millions):
PAYMENTS DUE BY PERIOD
July 25, 2015 Total
Less than
1 Year
1to3
Years
3to5
Years
More than
5 Years
Operating leases .................................................... $ 1,142 $ 346 $ 435 $ 178 $ 183
Purchase commitments with contract manufacturers and suppliers . . 4,078 4,078———
Other purchase obligations ......................................... 2,012 604 815 536 57
Long-term debt including the current portion ....................... 25,251 3,850 6,651 8,250 6,500
Other long-term liabilities .......................................... 1,213 — 350 72 791
Total by period ................................................ $ 33,696 $ 8,878 $ 8,251 $ 9,036 $ 7,531
Other long-term liabilities (uncertainty in the timing of future
payments) ....................................................... 2,122
Total ..................................................... $ 35,818
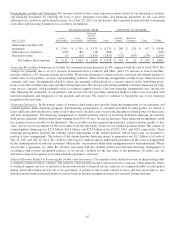
Operating Leases For more information on our operating leases, see Note 12 to the Consolidated Financial Statements.
Purchase Commitments with Contract Manufacturers and Suppliers We purchase components from a variety of suppliers and
use several contract manufacturers to provide manufacturing services for our products. A significant portion of our reported
estimated purchase commitments arising from these agreements are firm, noncancelable, and unconditional commitments. We
record a liability for firm, noncancelable, and unconditional purchase commitments for quantities in excess of our future demand
forecasts consistent with the valuation of our excess and obsolete inventory. See further discussion in “Inventory Supply Chain.”
As of July 25, 2015, the liability for these purchase commitments was $156 million and is recorded in other current liabilities and
is not included in the preceding table.
64