Cisco 2015 Annual Report Download - page 103
Download and view the complete annual report
Please find page 103 of the 2015 Cisco annual report below. You can navigate through the pages in the report by either clicking on the pages listed below, or by using the keyword search tool below to find specific information within the annual report.-
 1
1 -
2
-
3
-
4
-
5
-
6
-
7
-
8
-
9
-
10
-
11
-
12
-
13
-
14
-
15
-
16
-
17
-
18
-
19
-
20
-
21
-
22
-
23
-
24
-
25
-
26
-
27
-
28
-
29
-
30
-
31
-
32
-
33
-
34
-
35
-
36
-
37
-
38
-
39
-
40
-
41
-
42
-
43
-
44
-
45
-
46
-
47
-
48
-
49
-
50
-
51
-
52
-
53
-
54
-
55
-
56
-
57
-
58
-
59
-
60
-
61
-
62
-
63
-
64
-
65
-
66
-
67
-
68
-
69
-
70
-
71
-
72
-
73
-
74
-
75
-
76
-
77
-
78
-
79
-
80
-
81
-
82
-
83
-
84
-
85
-
86
-
87
-
88
-
89
-
90
-
91
-
92
-
 93
93 -
 94
94 -
 95
95 -
 96
96 -
 97
97 -
 98
98 -
 99
99 -
 100
100 -
 101
101 -
 102
102 -
 103
103 -
 104
104 -
 105
105 -
 106
106 -
 107
107 -
 108
108 -
 109
109 -
 110
110 -
 111
111 -
 112
112 -
 113
113 -
114
-
115
-
116
-
117
-
118
-
119
-
120
-
121
-
122
-
123
-
124
-
125
-
126
-
127
-
128
-
129
-
130
-
131
-
132
-
133
-
134
-
135
-
136
-
137
-
138
-
139
-
140
 |
 |

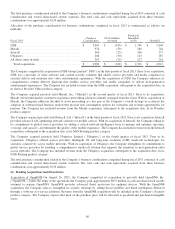
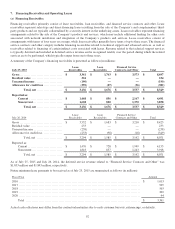
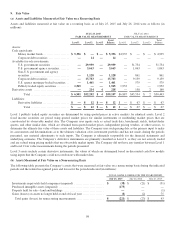
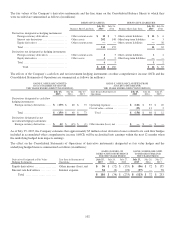
8. Investments
(a) Summary of Available-for-Sale Investments
The following tables summarize the Company’s available-for-sale investments (in millions):
July 25, 2015
Amortized
Cost
Gross
Unrealized
Gains
Gross
Unrealized
Losses
Fair
Value
Fixed income securities:
U.S. government securities ............................ $ 29,904 $ 41 $ (6) $ 29,939
U.S. government agency securities .................... 3,662 2 (1) 3,663
Non-U.S. government and agency securities .......... 1,128 1 (1) 1,128
Corporate debt securities ............................. 15,802 34 (53) 15,783
U.S. agency mortgage-backed securities .............. 1,456 8 (3) 1,461
Total fixed income securities ..................... 51,952 86 (64) 51,974
Publicly traded equity securities ........................... 1,092 480 (7) 1,565
Total ......................................... $ 53,044 $ 566 $ (71) $ 53,539
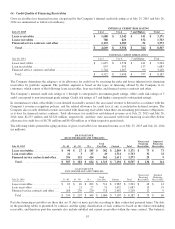
July 26, 2014
Amortized
Cost
Gross
Unrealized
Gains
Gross
Unrealized
Losses
Fair
Value
Fixed income securities:
U.S. government securities ............................. $ 31,717 $ 29 $ (12) $ 31,734
U.S. government agency securities ...................... 1,062 1 — 1,063
Non-U.S. government and agency securities ............ 860 2 (1) 861
Corporate debt securities ............................... 9,092 74 (7) 9,159
U.S. agency mortgage-backed securities ................ 574 5 — 579
Total fixed income securities ...................... 43,305 111 (20) 43,396
Publicly traded equity securities ............................. 1,314 648 (10) 1,952
Total ......................................... $ 44,619 $ 759 $ (30) $ 45,348
Non-U.S. government and agency securities include agency and corporate debt securities that are guaranteed by non-U.S.
governments.
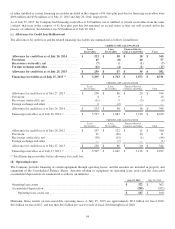
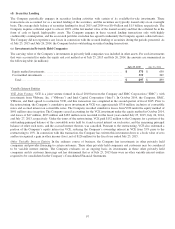
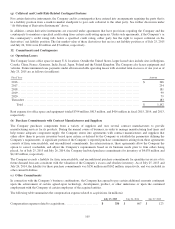
(b) Gains and Losses on Available-for-Sale Investments
The following table presents the gross realized gains and gross realized losses related to the Company’s available-for-sale
investments (in millions):
Years Ended July 25, 2015 July 26, 2014 July 27, 2013
Gross realized gains ........................................................ $ 221 $ 341 $ 264
Gross realized losses ....................................................... (64) (41) (216)
Total .................................................................. $ 157 $ 300 $ 48
The following table presents the realized net gains related to the Company’s available-for-sale investments by security type (in
millions):
Years Ended July 25, 2015 July 26, 2014 July 27, 2013
Net gains on investments in publicly traded equity securities ................ $ 116 $ 253 $ 17
Net gains on investments in fixed income securities ......................... 41 47 31
Total .................................................................. $ 157 $ 300 $ 48
There were no impairment charges on available-for-sale investments for fiscal 2015. For fiscal 2014, the realized net gains related
to the Company’s available-for-sale investments included impairment charges of $11 million. These impairment charges related
to publicly traded equity securities and were due to a decline in the fair value of those securities below their cost basis that were
determined to be other than temporary. There were no impairment charges on available-for-sale investments for fiscal 2013.
95