Cisco 2015 Annual Report Download - page 44
Download and view the complete annual report
Please find page 44 of the 2015 Cisco annual report below. You can navigate through the pages in the report by either clicking on the pages listed below, or by using the keyword search tool below to find specific information within the annual report.-
 1
1 -
2
-
3
-
4
-
5
-
6
-
7
-
8
-
9
-
10
-
11
-
12
-
13
-
14
-
15
-
16
-
17
-
18
-
19
-
20
-
21
-
22
-
23
-
24
-
25
-
26
-
27
-
28
-
29
-
30
-
31
-
32
-
33
-
 34
34 -
 35
35 -
 36
36 -
 37
37 -
 38
38 -
 39
39 -
 40
40 -
 41
41 -
 42
42 -
 43
43 -
 44
44 -
 45
45 -
 46
46 -
 47
47 -
 48
48 -
 49
49 -
 50
50 -
 51
51 -
 52
52 -
 53
53 -
 54
54 -
55
-
56
-
57
-
58
-
59
-
60
-
61
-
62
-
63
-
64
-
65
-
66
-
67
-
68
-
69
-
70
-
71
-
72
-
73
-
74
-
75
-
76
-
77
-
78
-
79
-
80
-
81
-
82
-
83
-
84
-
85
-
86
-
87
-
88
-
89
-
90
-
91
-
92
-
93
-
94
-
95
-
96
-
97
-
98
-
99
-
100
-
101
-
102
-
103
-
104
-
105
-
106
-
107
-
108
-
109
-
110
-
111
-
112
-
113
-
114
-
115
-
116
-
117
-
118
-
119
-
120
-
121
-
122
-
123
-
124
-
125
-
126
-
127
-
128
-
129
-
130
-
131
-
132
-
133
-
134
-
135
-
136
-
137
-
138
-
139
-
140
 |
 |

Item 7. Management’s Discussion and Analysis of Financial Condition and Results of Operations
Forward-Looking Statements
This Annual Report on Form 10-K, including this Management’s Discussion and Analysis of Financial Condition and Results of
Operations, contains forward-looking statements regarding future events and our future results that are subject to the safe harbors
created under the Securities Act of 1933 (the “Securities Act”) and the Securities Exchange Act of 1934 (the “Exchange Act”).
All statements other than statements of historical facts are statements that could be deemed forward-looking statements. These
statements are based on current expectations, estimates, forecasts, and projections about the industries in which we operate and
the beliefs and assumptions of our management. Words such as “expects,” “anticipates,” “targets,” “goals,” “projects,” “intends,”
“plans,” “believes,” “seeks,” “estimates,” “continues,” “endeavors,” “strives,” “may,” variations of such words, and similar
expressions are intended to identify such forward-looking statements. In addition, any statements that refer to projections of our
future financial performance, our anticipated growth and trends in our businesses, and other characterizations of future events or
circumstances are forward-looking statements. Readers are cautioned that these forward-looking statements are only predictions
and are subject to risks, uncertainties, and assumptions that are difficult to predict, including those under “Part I, Item 1A. Risk
Factors,” and elsewhere herein. Therefore, actual results may differ materially and adversely from those expressed in any
forward-looking statements. We undertake no obligation to revise or update any forward-looking statements for any reason.
OVERVIEW
Cisco designs and sells broad lines of products, provides services and delivers integrated solutions to develop and connect
networks around the world, building the Internet. Over the last 30 plus years, we have been the world’s leader in connecting
people, things and technologies—to each other and to the Internet—realizing our vision of changing the way the world works,
lives, plays and learns.
Today, we have over 70,000 employees in over 400 offices worldwide who design, produce, sell, and deliver integrated products,
services, and solutions. Over time, we have expanded to new markets that are a natural extension of our core networking
business, as the network has become the platform for automating, orchestrating, integrating, and delivering an ever-increasing
array of information technology (IT)–based products and services.
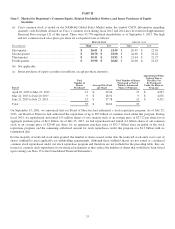
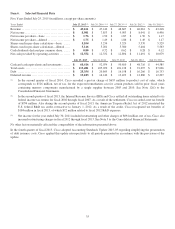
A summary of our results is as follows (in millions, except percentages and per-share amounts):
Three Months Ended Years Ended
July 25,
2015
July 26,
2014 Variance
July 25,
2015
July 26,
2014 Variance
Revenue .................................... $ 12,843 $ 12,357 3.9 % $ 49,161 $ 47,142 4.3 %
Gross margin percentage .................... 60.2% 59.9% 0.3 pts 60.4% 58.9% 1.5 pts
Research and development .................. $ 1,548 $ 1,593 (2.8)% $ 6,207 $ 6,294 (1.4)%
Sales and marketing ........................ $ 2,549 $ 2,473 3.1 % $ 9,821 $ 9,503 3.3 %
General and administrative .................. $ 536 $ 508 5.5 % $ 2,040 $ 1,934 5.5 %
Total R&D, sales and marketing, general
and administrative ........................ $ 4,633 $ 4,574 1.3 % $ 18,068 $ 17,731 1.9 %
Total as a percentage of revenue ............ 36.1% 37.0% (0.9) pts 36.8% 37.6% (0.8) pts
Amortization of purchased intangible assets
included in operating expenses ........... $ 146 $ 68 114.7 % $ 359 $ 275 30.5 %
Restructuring and other charges ............. $73$ 82 (11.0)% $ 484 $ 418 15.8 %
Operating income as a percentage of
revenue .................................. 22.4% 21.7% 0.7 pts 21.9% 19.8% 2.1 pts
Income tax percentage ...................... 20.9% 19.1% 1.8 pts 19.8% 19.2% 0.6 pts
Net income ................................. $ 2,319 $ 2,247 3.2 % $ 8,981 $ 7,853 14.4 %
Net income as a percentage of revenue ...... 18.1% 18.2% (0.1) pts 18.3% 16.7% 1.6 pts
Earnings per share—diluted ................. $ 0.45 $ 0.43 4.7 % $ 1.75 $ 1.49 17.4 %
36