Cisco 2015 Annual Report Download - page 82
Download and view the complete annual report
Please find page 82 of the 2015 Cisco annual report below. You can navigate through the pages in the report by either clicking on the pages listed below, or by using the keyword search tool below to find specific information within the annual report.-
 1
1 -
2
-
3
-
4
-
5
-
6
-
7
-
8
-
9
-
10
-
11
-
12
-
13
-
14
-
15
-
16
-
17
-
18
-
19
-
20
-
21
-
22
-
23
-
24
-
25
-
26
-
27
-
28
-
29
-
30
-
31
-
32
-
33
-
34
-
35
-
36
-
37
-
38
-
39
-
40
-
41
-
42
-
43
-
44
-
45
-
46
-
47
-
48
-
49
-
50
-
51
-
52
-
53
-
54
-
55
-
56
-
57
-
58
-
59
-
60
-
61
-
62
-
63
-
64
-
65
-
66
-
67
-
68
-
69
-
70
-
71
-
 72
72 -
 73
73 -
 74
74 -
 75
75 -
 76
76 -
 77
77 -
 78
78 -
 79
79 -
 80
80 -
 81
81 -
 82
82 -
 83
83 -
 84
84 -
 85
85 -
 86
86 -
 87
87 -
 88
88 -
 89
89 -
 90
90 -
 91
91 -
 92
92 -
93
-
94
-
95
-
96
-
97
-
98
-
99
-
100
-
101
-
102
-
103
-
104
-
105
-
106
-
107
-
108
-
109
-
110
-
111
-
112
-
113
-
114
-
115
-
116
-
117
-
118
-
119
-
120
-
121
-
122
-
123
-
124
-
125
-
126
-
127
-
128
-
129
-
130
-
131
-
132
-
133
-
134
-
135
-
136
-
137
-
138
-
139
-
140
 |
 |

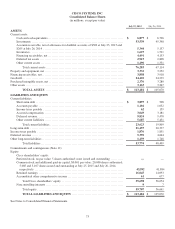
CISCO SYSTEMS, INC.
Consolidated Statements of Operations
(in millions, except per-share amounts)
Years Ended July 25, 2015 July 26, 2014 July 27, 2013
REVENUE:
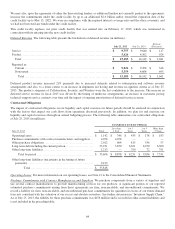
Product ................................................................. $ 37,750 $ 36,172 $ 38,029
Service .................................................................. 11,411 10,970 10,578
Total revenue ...................................................... 49,161 47,142 48,607
COST OF SALES:
Product ................................................................. 15,377 15,641 15,541
Service .................................................................. 4,103 3,732 3,626
Total cost of sales .................................................. 19,480 19,373 19,167
GROSS MARGIN .......................................................... 29,681 27,769 29,440
OPERATING EXPENSES:
Research and development .............................................. 6,207 6,294 5,942
Sales and marketing ..................................................... 9,821 9,503 9,538
General and administrative .............................................. 2,040 1,934 2,264
Amortization of purchased intangible assets ............................. 359 275 395
Restructuring and other charges ......................................... 484 418 105
Total operating expenses ........................................... 18,911 18,424 18,244
OPERATING INCOME .................................................... 10,770 9,345 11,196
Interest income .......................................................... 769 691 654
Interest expense ......................................................... (566) (564) (583)
Other income (loss), net ................................................. 228 243 (40)
Interest and other income (loss), net ................................ 431 370 31
INCOME BEFORE PROVISION FOR INCOME TAXES ................ 11,201 9,715 11,227
Provision for income taxes ................................................... 2,220 1,862 1,244
NET INCOME ......................................................... $ 8,981 $ 7,853 $ 9,983
Net income per share:
Basic ...................................................................... $ 1.76 $ 1.50 $ 1.87
Diluted .................................................................... $ 1.75 $ 1.49 $ 1.86
Shares used in per-share calculation:
Basic ...................................................................... 5,104 5,234 5,329
Diluted .................................................................... 5,146 5,281 5,380
Cash dividends declared per common share ................................... $ 0.80 $ 0.72 $ 0.62
See Notes to Consolidated Financial Statements.
74