Cisco 2015 Annual Report Download - page 107
Download and view the complete annual report
Please find page 107 of the 2015 Cisco annual report below. You can navigate through the pages in the report by either clicking on the pages listed below, or by using the keyword search tool below to find specific information within the annual report.-
 1
1 -
2
-
3
-
4
-
5
-
6
-
7
-
8
-
9
-
10
-
11
-
12
-
13
-
14
-
15
-
16
-
17
-
18
-
19
-
20
-
21
-
22
-
23
-
24
-
25
-
26
-
27
-
28
-
29
-
30
-
31
-
32
-
33
-
34
-
35
-
36
-
37
-
38
-
39
-
40
-
41
-
42
-
43
-
44
-
45
-
46
-
47
-
48
-
49
-
50
-
51
-
52
-
53
-
54
-
55
-
56
-
57
-
58
-
59
-
60
-
61
-
62
-
63
-
64
-
65
-
66
-
67
-
68
-
69
-
70
-
71
-
72
-
73
-
74
-
75
-
76
-
77
-
78
-
79
-
80
-
81
-
82
-
83
-
84
-
85
-
86
-
87
-
88
-
89
-
90
-
91
-
92
-
93
-
94
-
95
-
96
-
 97
97 -
 98
98 -
 99
99 -
 100
100 -
 101
101 -
 102
102 -
 103
103 -
 104
104 -
 105
105 -
 106
106 -
 107
107 -
 108
108 -
 109
109 -
 110
110 -
 111
111 -
 112
112 -
 113
113 -
 114
114 -
 115
115 -
 116
116 -
 117
117 -
118
-
119
-
120
-
121
-
122
-
123
-
124
-
125
-
126
-
127
-
128
-
129
-
130
-
131
-
132
-
133
-
134
-
135
-
136
-
137
-
138
-
139
-
140
 |
 |

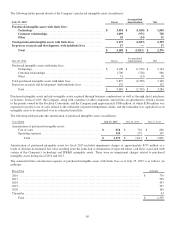
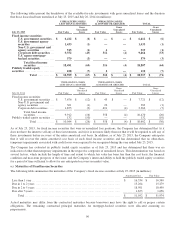
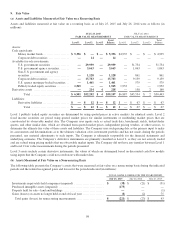
These assets were measured at fair value due to events or circumstances the Company identified as having significant impact on
their fair value during the respective periods. To arrive at the valuation of these assets, the Company considers any significant
changes in the financial metrics and economic variables and also uses third-party valuation reports to assist in the valuation as
necessary.
The fair value measurement of the impaired investments was classified as Level 3 because significant unobservable inputs were
used in the valuation due to the absence of quoted market prices and inherent lack of liquidity. Significant unobservable inputs,
which included financial metrics of comparable private and public companies, financial condition and near-term prospects of the
investees, recent financing activities of the investees, and the investees’ capital structure as well as other economic variables,
reflected the assumptions market participants would use in pricing these assets. The impairment charges, representing the
difference between the net book value and the fair value as a result of the evaluation, were recorded to other income (loss), net.
The remaining carrying value of the investments that were impaired was $36 million as of July 25, 2015.
The fair value for purchased intangibles assets measured at fair value on a nonrecurring basis was categorized as Level 3 due to
the use of significant unobservable inputs in the valuation. Significant unobservable inputs that were used included expected
revenues and net income related to the assets and the expected life of the assets. The difference between the estimated fair value
and the carrying value of the assets was recorded as an impairment charge, which was included in product cost of sales and
operating expenses as applicable. See Note 4. The remaining carrying value of the specific purchased intangible assets that were
impaired was $5 million as of July 25, 2015.
The fair value of property held for sale was measured with the assistance of third-party valuation models, which used discounted
cash flow techniques as part of their analysis. The fair value measurement was categorized as Level 3, as significant unobservable
inputs were used in the valuation report. The impairment charges as a result of the valuations, which represented the difference
between the fair value less cost to sell and the carrying amount of the assets held for sale, were included in G&A expenses.
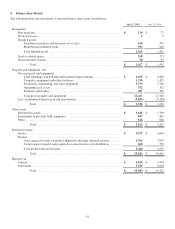
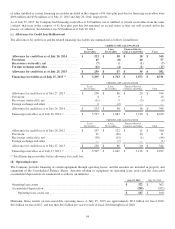
(c) Other Fair Value Disclosures
The carrying value of the Company’s investments in privately held companies that were accounted for under the cost method was
$319 million and $269 million as of July 25, 2015 and July 26, 2014, respectively. It was not practicable to estimate the fair value
of this portfolio.
The fair value of the Company’s short-term loan receivables and financed service contracts approximates their carrying value due
to their short duration. The aggregate carrying value of the Company’s long-term loan receivables and financed service contracts
and other as of July 25, 2015 and July 26, 2014 was $2.2 billion and $2.1 billion, respectively. The estimated fair value of the
Company’s long-term loan receivables and financed service contracts and other approximates their carrying value. The Company
uses significant unobservable inputs in determining discounted cash flows to estimate the fair value of its long-term loan
receivables and financed service contracts, and therefore they are categorized as Level 3.
As of July 25, 2015 and July 26, 2014, the estimated fair value of the short-term debt approximates its carrying value due to the
short maturities. As of July 25, 2015, the fair value of the Company’s senior notes and other long-term debt was $26.6 billion,
with a carrying amount of $25.4 billion. This compares to a fair value of $22.4 billion and a carrying amount of $20.8 billion as
of July 26, 2014. The fair value of the senior notes and other long-term debt was determined based on observable market prices in
a less active market and was categorized as Level 2 in the fair value hierarchy.
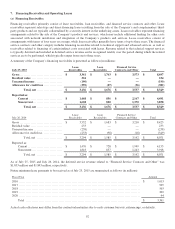
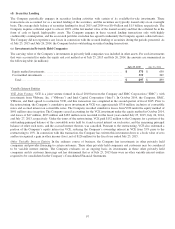
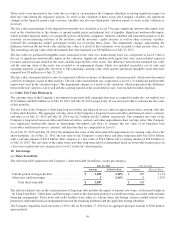
10. Borrowings
(a) Short-Term Debt
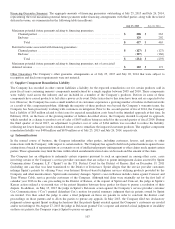
The following table summarizes the Company’s short-term debt (in millions, except percentages):
July 25, 2015 July 26, 2014
Amount Effective Rate Amount Effective Rate
Current portion of long-term debt ........................ $ 3,894 2.48% $ 500 3.11%
Other notes and borrowings .............................. 3 2.44% 8 2.67%
Total short-term debt ............................... $ 3,897 $ 508
The effective interest rate on the current portion of long-term debt includes the impact of interest rate swaps, as discussed further in
“(b) Long-Term Debt.” Other notes and borrowings consist of the short-term portion of secured borrowings associated with customer
financing arrangements. These notes and credit facilities were subject to various terms and foreign currency market interest rates
pursuant to individual financial arrangements between the financing institution and the applicable foreign subsidiary.
The Company repaid the fixed-rate notes (2.90%) due on November 17, 2014 for an aggregate principal amount of $500 million
upon maturity.
99