Cisco 2015 Annual Report Download
Download and view the complete annual report
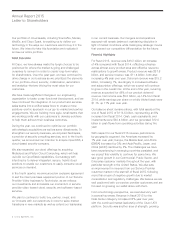
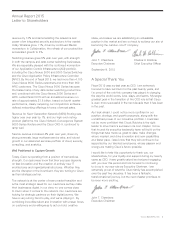
Please find the complete 2015 Cisco annual report below. You can navigate through the pages in the report by either clicking on the pages listed below, or by using the keyword search tool below to find specific information within the annual report.-
 1
1 -
 2
2 -
 3
3 -
 4
4 -
 5
5 -
 6
6 -
 7
7 -
 8
8 -
 9
9 -
 10
10 -
 11
11 -
 12
12 -
13
-
14
-
15
-
16
-
17
-
18
-
19
-
20
-
21
-
22
-
23
-
24
-
25
-
26
-
27
-
28
-
29
-
30
-
31
-
32
-
33
-
34
-
35
-
36
-
37
-
38
-
39
-
40
-
41
-
42
-
43
-
44
-
45
-
46
-
47
-
48
-
49
-
50
-
51
-
52
-
53
-
54
-
55
-
56
-
57
-
58
-
59
-
60
-
61
-
62
-
63
-
64
-
65
-
66
-
67
-
68
-
69
-
70
-
71
-
72
-
73
-
74
-
75
-
76
-
77
-
78
-
79
-
80
-
81
-
82
-
83
-
84
-
85
-
86
-
87
-
88
-
89
-
90
-
91
-
92
-
93
-
94
-
95
-
96
-
97
-
98
-
99
-
100
-
101
-
102
-
103
-
104
-
105
-
106
-
107
-
108
-
109
-
110
-
111
-
112
-
113
-
114
-
115
-
116
-
117
-
118
-
119
-
120
-
121
-
122
-
123
-
124
-
125
-
126
-
127
-
128
-
129
-
130
-
131
-
132
-
133
-
134
-
135
-
136
-
137
-
138
-
139
-
140
 |
 |

Cisco Systems, Inc. 2015 Annual Report
Table of contents
-
Page 1
Cisco Systems, Inc. 2015 Annual Report -
Page 2
-
Page 3
... ability to lead market transitions. More than five years ago, we saw the impact that connecting people, processes, data, and things would have on organizations and countries. Today, across the board, our customers' top priority is to use technology to drive growth and productivity, manage risk, and... -
Page 4
... provider video toward cloud, security, and software-based services. We plan to continue to build, buy, partner, invest, and co-innovate with our customers in order to seize market transitions in new markets as well as extend our leadership in our current business. Our mergers and acquisitions... -
Page 5
... in terms of annual sales. Revenue for Next-Generation Network (NGN) Routing was higher year over year by 1%, and our high-end routing product platforms, the Cisco Network Convergence System 6000 Series Routers and the Cisco CRS-X, continued to ramp well. Service revenue increased 4% year over year... -
Page 6
-
Page 7
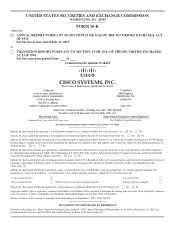
... jurisdiction of incorporation or organization) 170 West Tasman Drive San Jose, California (Address of principal executive offices) 77-0059951 (IRS Employer Identification No.) 95134-1706 (Zip Code) Registrant's telephone number, including area code: (408) 526-4000 Securities registered pursuant to... -
Page 8
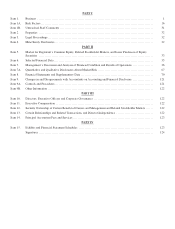
... Market Risk ...Financial Statements and Supplementary Data ...Changes in and Disagreements with Accountants on Accounting and Financial Disclosure ...Controls and Procedures ...Other Information ...PART III Directors, Executive Officers and Corporate Governance ...Executive Compensation ...Security... -
Page 9
... following categories: Switching; Next-Generation Network (NGN) Routing; Collaboration; Service Provider Video; Data Center; Wireless; Security; and Other Products. In addition to our product offerings, we provide a broad range of service offerings, including technical support services and advanced... -
Page 10
... network infrastructures. We believe the successful products and solutions in this market will combine application-specific integrated circuits (ASICs) with hardware and software elements together to meet customers' total cost of ownership, quality, security, scalability, and experience requirements... -
Page 11
..., branch offices, and data centers. Switches are used within buildings in local-area networks (LANs) and across great distances in wide-area networks (WANs). Our switching products offer many forms of connectivity to end users, workstations, IP phones, wireless access points, and servers and also... -
Page 12
... interconnects public and private wireline and mobile networks for mobile, data, voice, and video applications. Our NGN Routing portfolio of hardware and software solutions consists primarily of physical and virtual routers, and routing and optical systems. Our solutions are designed to meet the... -
Page 13
... to combine ASICs, systems, and software to develop NGN Routing products and services aligned with the needs of our customers. Collaboration Our Collaboration portfolio integrates voice, video, data, and mobile applications on fixed and mobile networks across a wide range of devices and related... -
Page 14
...: Service Provider Video Infrastructure and Cable Access Set-top boxes: • Digital cable and IP set-top boxes • Video gateways • Digital transport adapters Cable modems: • Data modems • Embedded media terminal adapters • Wireless gateways Connected Life platforms Cable/Telecommunications... -
Page 15
...• Cisco UCS Manager and UCS Director Management Software Private and Hybrid Cloud: • Cisco ONE Enterprise Cloud Suite • Cisco Intercloud Fabric Server Access Virtualization: • Cisco Nexus 1000V During fiscal 2015, we significantly expanded the Cisco UCS portfolio into data-intensive, service... -
Page 16
... and advanced services. Technical support services help our customers ensure their products operate efficiently, remain available, and benefit from the most up-to-date system and application software that we have developed. These services help customers protect their network investments, manage risk... -
Page 17
...-based and application-based services. Service providers use a variety of our routing and switching, optical, security, video, mobility, and network management products, systems, and services for their own networks. In addition, many service providers use Cisco data center, virtualization, and... -
Page 18
... As of the end of fiscal 2015, our worldwide sales and marketing departments consisted of approximately 25,000 employees, including managers, sales representatives, and technical support personnel. We have field sales offices in 93 countries, and we sell our products and services both directly and... -
Page 19
.... Mergers and acquisitions of high-technology companies are inherently risky, especially if the acquired company has yet to ship a product. No assurance can be given that our previous or future acquisitions will be successful or will not materially adversely affect our financial condition or... -
Page 20
...data center business have made acquisitions, or announced new strategic alliances, designed to position them to provide end-to-end technology solutions for the enterprise data center. As a result of all of these developments, we face greater competition in the development and sale of enterprise data... -
Page 21
... new products and features to address the requirements of our markets. We allocate our research and development budget among our product categories, which consist of Switching, NGN Routing, Collaboration, Service Provider Video, Data Center, Wireless, Security, and Other Product technologies... -
Page 22
... sales (1) ...Research and development ...Sales and marketing ...General and administrative ...Total ...(1) 36,222 35,611 71,833 17,186 22,542 24,762 7,343 71,833 Cost of sales includes manufacturing support, services, and training. We consider the relationships with our employees to be positive... -
Page 23
...number of leadership positions with Cisco. She served, successively, as a manager, director and vice president within Cisco's global supply chain organization from March 1995 until November 2003. In November 2003, Ms. Jacoby assumed the role of Vice President, Customer Service and Operations Systems... -
Page 24
... of our customers, channel partners, contract manufacturers and suppliers to obtain financing or to fund capital expenditures, especially during a period of global credit market disruption or in the event of customer, channel partner, contract manufacturer or supplier financial problems Share-based... -
Page 25
..., such as data center virtualization, software, security, and cloud, while also focusing on maintaining leadership in routing, switching and services. However, the return on our investments may be lower, or may develop more slowly, than we expect. If we do not achieve the benefits anticipated from... -
Page 26
... margin markets, including markets with different pricing and cost structures, through acquisitions or internal development Sales discounts Increases in material, labor or other manufacturing-related costs, which could be significant especially during periods of supply constraints Excess inventory... -
Page 27
...sell-through method using information provided by them. These distributors are generally given business terms that allow them to return a portion of inventory, receive credits for changes in selling prices, and participate in various cooperative marketing programs. If sales through indirect channels... -
Page 28
...data center business have made acquisitions, or announced new strategic alliances, designed to position them to provide end-to-end technology solutions for the enterprise data center. As a result of all of these developments, we face greater competition in the development and sale of enterprise data... -
Page 29
... in order to meet customer expectations. If we ultimately determine that we have excess inventory, we may have to reduce our prices and write down inventory, which in turn could result in lower gross margins. SUPPLY CHAIN ISSUES, INCLUDING FINANCIAL PROBLEMS OF CONTRACT MANUFACTURERS OR COMPONENT... -
Page 30
... competitors, and companies in other markets Manufacturing capacity and component supply constraints could continue to be significant issues for us. We purchase components from a variety of suppliers and use several contract manufacturers to provide manufacturing services for our products. During... -
Page 31
..., storage access and virtualization resources in a single system, which is designed to address the fundamental transformation occurring in the enterprise data center. While our Cisco UCS offering remains a significant focus area for us, several market transitions are also shaping our strategies and... -
Page 32
... related to our engineering, sales, service and marketing functions as we realign and dedicate resources on key growth areas, such as data center virtualization, software, security, and cloud, and we also intend to focus on maintaining leadership in routing, switching and services. We are likely... -
Page 33
... supply partners Insufficient revenue to offset increased expenses associated with acquisitions The potential loss of key employees, customers, distributors, vendors and other business partners of the companies we acquire following and continuing after announcement of acquisition plans Acquisitions... -
Page 34
...enterprise data center business have made acquisitions, or announced new strategic alliances, designed to position them with the ability to provide end-to-end technology solutions for the enterprise data center. Companies that are strategic alliance partners in some areas of our business may acquire... -
Page 35
... and financial condition. A portion of our sales is derived through our distributors. These distributors are generally given business terms that allow them to return a portion of inventory, receive credits for changes in selling prices, and participate in various cooperative marketing programs. We... -
Page 36
... such licenses or rights on favorable terms, or the need to engage in litigation regarding these matters, could have a material adverse effect on our business, operating results, and financial condition. Moreover, the inclusion in our products of software or other intellectual property licensed from... -
Page 37
...of Northern California. Stock incentive plans are designed to reward employees for their long-term contributions and provide incentives for them to remain with us. Volatility or lack of positive performance in our stock price or equity incentive awards, or changes to our overall compensation program... -
Page 38
... in tax incentives; by transfer pricing adjustments, including the effect of acquisitions on our intercompany R&D cost sharing arrangement and legal structure; by tax effects of nondeductible compensation; by tax costs related to intercompany realignments; by changes in accounting principles; or by... -
Page 39
... We have several strategic alliances with large and complex organizations and other companies with which we work to offer complementary products and services and have established a joint venture to market services associated with our Cisco Unified Computing System products. These arrangements are... -
Page 40
...the surrounding areas of San Jose, California; Research Triangle Park, North Carolina; Richardson, Texas; Lawrenceville, Georgia; and Boston, Massachusetts. We also own land for expansion in some of these locations. In addition, we lease office space in many U.S. locations. Outside the United States... -
Page 41
... of equity securities (in millions, except per-share amounts): Total Number of Shares Purchased Total Number of Shares Purchased as Part of Publicly Announced Plans or Programs Approximate Dollar Value of Shares That May Yet Be Purchased Under the Plans or Programs Period Average Price Paid per... -
Page 42
... Company's common stock and in each of the indexes (with the reinvestment of all dividends) on the date specified. Shareholder returns over the indicated period are based on historical data and should not be considered indicative of future shareholder returns. Comparison of 5-Year Cumulative Total... -
Page 43
..., net of tax, for the expected remediation cost for certain products sold in prior fiscal years containing memory components manufactured by a single supplier between 2005 and 2010. See Note 12(f) to the Consolidated Financial Statements. In the second quarter of fiscal 2013, the Internal Revenue... -
Page 44
... the world works, lives, plays and learns. Today, we have over 70,000 employees in over 400 offices worldwide who design, produce, sell, and deliver integrated products, services, and solutions. Over time, we have expanded to new markets that are a natural extension of our core networking business... -
Page 45
... of Service Provider Video which decreased by 10%. Our deferred product revenue grew 21% year-over-year driven by subscription and software revenue arrangements, with strength in Collaboration, Security and Wireless. Service revenue increased by 4% year over year. In summary, during fiscal 2015, we... -
Page 46
... strategy and focus areas, see Item 1. Business. Other Key Financial Measures The following is a summary of our other key financial measures for fiscal 2015 compared with fiscal 2014 (in millions, except days sales outstanding in accounts receivable (DSO) and annualized inventory turns): Fiscal 2015... -
Page 47
...arrangement. Delivery has occurred. Shipping documents and customer acceptance, when applicable, are used to verify delivery. The fee is fixed or determinable. We assess whether the fee is fixed or determinable based on the payment terms associated with the transaction and whether the sales price is... -
Page 48
... which we refer to as two-tier systems of sales to the end customer. Revenue from distributors is recognized based on a sell-through method using information provided by them. Our distributors participate in various cooperative marketing and other programs, and we maintain estimated accruals and... -
Page 49
... upon historical trends in the rate of customer cases and the cost to support the customer cases within the warranty period. Overhead cost is applied based on estimated time to support warranty activities. The provision for product warranties during fiscal 2015, 2014, and 2013 was $696 million, $704... -
Page 50
... for a period of time sufficient to allow for any anticipated recovery in market value. There were no impairment charges on our investments in publicly traded equity securities in fiscal 2015 and 2013, and we recognized $11 million of such impairment charges in earnings for fiscal 2014. There were... -
Page 51
...audit settlements, nondeductible compensation, international realignments, and transfer pricing adjustments. Our effective tax rate was 19.8%, 19.2%, and 11.1% in fiscal 2015, 2014, and 2013, respectively. Significant judgment is required in evaluating our uncertain tax positions and determining our... -
Page 52
... on a geographic basis, organized into three geographic segments. Our revenue, which includes product and service for each segment, is summarized in the following table (in millions, except percentages): July 25, 2015 Years Ended July 26, 2014 July 27, 2013 2015 vs. 2014 Variance Variance in Dollars... -
Page 53
... in Canada, and 13% in Brazil, partially offset by an increase of 2% in Mexico. EMEA Fiscal 2015 Compared with Fiscal 2014 Product revenue in the EMEA segment increased by 2%, driven by growth in the commercial, public sector and enterprise markets. Product revenue in the service provider market was... -
Page 54
APJC Fiscal 2015 Compared with Fiscal 2014 The decrease in product revenue in the APJC segment of 4% was led by a significant decline in the service provider market and, to a lesser degree, in the public sector and enterprise markets. These decreases were partially offset by growth in the commercial... -
Page 55
... switching, and storage); NGN Routing (high-end routers, mid-range and lowend routers, and other NGN Routing products); Collaboration (unified communications, Cisco TelePresence, and conferencing); Service Provider Video (infrastructure, video software, and solutions and cable access); Data Center... -
Page 56
..., decrease in sales of our Service Provider Video infrastructure products, due primarily to lower sales of set-top boxes. We also experienced a decrease in revenue from cable access products within this product category. On July 22, 2015, we entered into an exclusive agreement to sell the client... -
Page 57
... the overall server market. Fiscal 2014 Compared with Fiscal 2013 We continue to experience solid growth in our Data Center product category, which grew by 27%, or $566 million, with sales growth of our Cisco Unified Computing System products across all geographic segments and customer markets. The... -
Page 58
...initiations associated with product sales provided an installed base of equipment being serviced which, in concert with new service offerings, were the primary factors driving the revenue increases. Advanced services revenue, which relates to consulting support services for specific customer network... -
Page 59
... and, as was the case in fiscal 2015, fiscal 2014 and fiscal 2013, may be adversely affected by product pricing attributable to competitive factors. Additionally, our manufacturing-related costs may be negatively impacted by constraints in our supply chain, which in turn could negatively affect... -
Page 60
... 2014, as compared with fiscal 2013. The increase was primarily due to higher sales volume in both advanced services and technical support services. The benefits to gross margin of increased sales volume were partially offset by increased cost impacts such as outside service costs, partner delivery... -
Page 61
... items for the years presented include the effects of amortization and impairments of acquisition-related intangible assets, sharebased compensation expense, significant litigation and other contingencies, impacts to cost of sales from purchase accounting adjustments to inventory, charges related to... -
Page 62
... degree, the timing of orders from our customers. We recognize revenue for sales to our distributors generally based on a sell-through method using information provided by them, and we maintain estimated accruals and allowances for all cooperative marketing and other programs. Product gross margin... -
Page 63
... a particular market in a timely manner with internally developed products, we may purchase or license technology from other businesses, or we may partner with or acquire businesses as an alternative to internal R&D. Fiscal 2014 Compared with Fiscal 2013 R&D expenses increased for fiscal 2014, as... -
Page 64
... targeted hiring in engineering, services, sales, and also by increased headcount from our recent acquisitions. Share-Based Compensation Expense The following table presents share-based compensation expense (in millions): Years Ended July 25, 2015 July 26, 2014 July 27, 2013 Cost of sales-product... -
Page 65
...one-time termination benefits and other associated costs. We expect this plan to be substantially completed during the first half of fiscal 2016. We plan to reinvest substantially all of the cost savings from the restructuring actions in key growth areas of our business such as data center, software... -
Page 66
...): Years Ended July 25, 2015 July 26, 2014 July 27, 2013 2015 vs. 2014 Variance in Dollars 2014 vs. 2013 Variance in Dollars Gains (losses) on investments, net: Publicly traded equity securities ...$ Fixed income securities ...Total available-for-sale investments ...Privately held companies ...Net... -
Page 67
... to higher gains on publicly traded equity securities in the current period as a result of market conditions and the timing of sales of these securities. The change in net losses on investments in privately held companies for the fiscal 2014 as compared with fiscal 2013 was primarily due to... -
Page 68
..., the rate at which products are shipped during the quarter (which we refer to as shipment linearity), the timing and collection of accounts receivable and financing receivables, inventory and supply chain management, deferred revenue, excess tax benefits resulting from share-based compensation, and... -
Page 69
... cost of sales are related to unrecognized revenue on shipments to distributors and retail partners as well as shipments to customers. Manufactured finished goods consist primarily of build-to-order and build-to-stock products. We purchase components from a variety of suppliers and use several... -
Page 70
... the receivables from the third party based on our standard payment terms. The volume of channel partner financing was $25.9 billion, $24.6 billion, and $23.8 billion in fiscal 2015, 2014, and 2013, respectively. These financing arrangements facilitate the working capital requirements of the channel... -
Page 71
... July 25, 2015 and July 26, 2014, respectively. Commercial Paper In fiscal 2011, we established a short-term debt financing program of up to $3.0 billion through the issuance of commercial paper notes. We use the proceeds from the issuance of commercial paper notes for general corporate purposes. We... -
Page 72
..., 2015. The product categories of Collaboration, Security, and Wireless were the key contributors to the increase. The increase in deferred service revenue in fiscal 2015 was driven by the timing of multiyear arrangements, an increase in customers paying technical support service contracts over time... -
Page 73
... employees of the acquired entities. See Note 12 to the Consolidated Financial Statements. Insieme Networks, Inc. In the third quarter of fiscal 2012, we made an investment in Insieme, an early stage company focused on research and development in the data center market. As set forth in the agreement... -
Page 74
... with certain of our available-for-sale investments. These transactions are accounted for as a secured lending of the securities, and the securities are typically loaned only on an overnight basis. The average daily balance of securities lending for fiscal 2015 and 2014 was $0.4 billion and... -
Page 75
Item 7A. Quantitative and Qualitative Disclosures About Market Risk Our financial position is exposed to a variety of risks, including interest rate risk, equity price risk, and foreign currency exchange risk. Interest Rate Risk Fixed Income Securities We maintain an investment portfolio of ... -
Page 76
... Balance Sheets and are accounted for using primarily either the cost or the equity method. As of July 25, 2015, the total carrying amount of our investments in privately held companies was $897 million, compared with $899 million at July 26, 2014. Some of the privately held companies in which we... -
Page 77
... with fiscal 2014. In fiscal 2014, foreign currency fluctuations, net of hedging, decreased our combined R&D, sales and marketing, and G&A expenses by approximately $153 million, or 0.9% as compared with fiscal 2013. To reduce variability in operating expenses and service cost of sales caused... -
Page 78
Item 8. Financial Statements and Supplementary Data Index to Consolidated Financial Statements Report of Independent Registered Public Accounting Firm ...Management's Report on Internal Control over Financial Reporting ...Consolidated Balance Sheets ...Consolidated Statements of Operations ...... -
Page 79
... of the Public Company Accounting Oversight Board (United States). Those standards require that we plan and perform the audits to obtain reasonable assurance about whether the financial statements are free of material misstatement and whether effective internal control over financial reporting was... -
Page 80
... reasonable assurance regarding prevention or timely detection of unauthorized acquisition, use, or disposition of the Company's assets that could have a material effect on the financial statements. Because of its inherent limitations, internal control over financial reporting may not prevent or... -
Page 81
... assets ...Property and equipment, net ...Financing receivables, net ...Goodwill ...Purchased intangible assets, net ...Other assets ...TOTAL ASSETS ...LIABILITIES AND EQUITY Current liabilities: Short-term debt ...Accounts payable ...Income taxes payable ...Accrued compensation ...Deferred revenue... -
Page 82
CISCO SYSTEMS, INC. Consolidated Statements of Operations (in millions, except per-share amounts) Years Ended July 25, 2015 July 26, 2014 July 27, 2013 REVENUE: Product ...Service ...Total revenue ...COST OF SALES: Product ...Service ...Total cost of sales ...GROSS MARGIN ...OPERATING EXPENSES: ... -
Page 83
CISCO SYSTEMS, INC. Consolidated Statements of Comprehensive Income (in millions) Years Ended July 25, 2015 July 26, 2014 July 27, 2013 Net income ...$ Available-for-sale investments: Change in net unrealized gains, net of tax benefit (expense) of $14, $(146), and $(2) for fiscal 2015, 2014, and ... -
Page 84
... equivalents acquired ...Purchases of investments in privately held companies ...Return of investments in privately held companies ...Acquisition of property and equipment ...Proceeds from sales of property and equipment ...Other ...Net cash used in investing activities ...Cash flows from financing... -
Page 85
... share) ...Tax effects from employee stock incentive plans ...Share-based compensation expense ...Purchase acquisitions and other ...BALANCE AT JULY 26, 2014 ...Net income ...Other comprehensive income (loss) ...Issuance of common stock ...Repurchase of common stock ...Shares repurchased for tax... -
Page 86
...1. Basis of Presentation The fiscal year for Cisco Systems, Inc. (the "Company" or "Cisco") is the 52 or 53 weeks ending on the last Saturday in July. Fiscal 2015, fiscal 2014, and fiscal 2013 are each 52-week fiscal years. The Consolidated Financial Statements include the accounts of Cisco and its... -
Page 87
... derecognized upon transfer, as these transfers qualify as true sales, and the Company receives a payment for the receivables from the third party based on the Company's standard payment terms. These financing arrangements facilitate the working capital requirements of the channel partners, and, in... -
Page 88
...for fiscal 2015, 2014, and 2013, respectively. Depreciation and amortization are computed using the straight-line method, generally over the following periods: Asset Category Period Buildings ...Building improvements ...Leasehold improvements ...Computer equipment and related software ...Production... -
Page 89
... each of July 25, 2015 and July 26, 2014 was $1.3 billion. The Company accrues for warranty costs, sales returns, and other allowances based on its historical experience. Shipping and handling fees billed to customers are included in revenue, with the associated costs included in cost of sales. 81 -
Page 90
...: Switching, Next-Generation Network (NGN) Routing, Collaboration, Service Provider Video, Data Center, Wireless, Security, and Other Products. The Company also provides technical support and advanced services. The Company has a broad customer base that encompasses virtually all types of public and... -
Page 91
..., and for employee stock purchase rights the Company estimates the fair value using the Black-Scholes model. The fair value for time-based stock awards and stock awards that are contingent upon the achievement of financial performance metrics is based on the grant date share price reduced by the... -
Page 92
... and it did not have a material impact on the Company's Consolidated Financial Statements. (x) Recent Accounting Standards or Updates Not Yet Effective In May 2014, the FASB issued an accounting standard update related to revenue from contracts with customers, which will supersede nearly all current... -
Page 93
... quarter of fiscal 2014. Prior to its acquisition, WhipTail was a provider of high-performance, scalable solid state memory systems. In the fourth quarter of fiscal 2015, the Company announced the end-of-sale and end-of-life dates for the Cisco UCS Invicta Series in connection with the decision... -
Page 94
...the acquisition date, in its Service Provider Video product category. The Company acquired privately held Meraki, Inc. ("Meraki") in the second quarter of fiscal 2013. Prior to its acquisition, Meraki offered mid-market customers on-premise networking solutions centrally managed from the cloud. With... -
Page 95
...of the acquisitions, individually and in the aggregate, were not material to the Company's financial results. During the third quarter of fiscal 2013, the Company completed the sale of its Linksys product line to a third party. The financial statement impact of the Company's Linksys product line and... -
Page 96
... details of the Company's intangible assets acquired through business combinations completed during fiscal 2015 and 2014 (in millions, except years): FINITE LIVES CUSTOMER RELATIONSHIPS OTHER WeightedWeightedAverage Useful Average Useful Life (in Years) Amount Life (in Years) Amount INDEFINITE LIVES... -
Page 97
... was capitalized as an intangible asset to be amortized over its estimated useful life. The following table presents the amortization of purchased intangible assets (in millions): Years Ended July 25, 2015 July 26, 2014 July 27, 2013 Amortization of purchased intangible assets: Cost of sales... -
Page 98
...-time termination benefits and other associated costs. These charges are primarily cash-based, and the Company expects the Fiscal 2015 Plan to be substantially completed during the first half of fiscal 2016. Fiscal 2014 Plan and Fiscal 2011 Plans In connection with a restructuring action announced... -
Page 99
... 2015 July 26, 2014 Inventories: Raw materials ...Work in process ...Finished goods: Distributor inventory and deferred cost of sales ...Manufactured finished goods ...Total finished goods ...Service-related spares ...Demonstration systems ...Total ...Property and equipment, net: Gross property and... -
Page 100
... related to the sale of the Company's products and services, which may include additional funding for other costs associated with network installation and integration of the Company's products and services. Lease receivables consist of arrangements with terms of four years on average, while... -
Page 101
... in deferred revenue. The Company also records deferred revenue associated with financing receivables when there are remaining performance obligations, as it does for financed service contracts. Total allowances for credit loss and deferred revenue as of July 25, 2015 and July 26, 2014 were $2,253... -
Page 102
...$ $ CREDIT LOSS ALLOWANCES Loan Financed Service Receivables Contracts and Other Total Allowance for credit loss as of July 27, 2013 ...Provisions ...Recoveries (write-offs), net ...Foreign exchange and other ...Allowance for credit loss as of July 26, 2014 ...Financing receivables as of July 26... -
Page 103
... related to the Company's available-for-sale investments by security type (in millions): Years Ended July 25, 2015 July 26, 2014 July 27, 2013 Net gains on investments in publicly traded equity securities ...Net gains on investments in fixed income securities ...Total ... $ $ 116 41 157 $ $ 253... -
Page 104
... than the cost basis, the financial condition and near-term prospects of the issuer, and the Company's intent and ability to hold the publicly traded equity securities for a period of time sufficient to allow for any anticipated recovery in market value. (c) Maturities of Fixed Income Securities The... -
Page 105
... Company ceased accounting for the VCE investment under the equity method in October 2014, and losses of $47 million, $223 million and $183 million were recorded for the fiscal years ended July 25, 2015, July 26, 2014, and July 27, 2013, respectively. Under the terms of the restructuring, VCE paid... -
Page 106
... (LOSSES) FOR THE YEARS ENDED July 25, 2015 July 26, 2014 July 27, 2013 Investments in privately held companies (impaired) ...Purchased intangible assets (impaired) ...Property held for sale-land and buildings ...Gains (losses) on assets no longer held at end of fiscal year ...Total gains (losses... -
Page 107
...were accounted for under the cost method was $319 million and $269 million as of July 25, 2015 and July 26, 2014, respectively. It was not practicable to estimate the fair value of this portfolio. The fair value of the Company's short-term loan receivables and financed service contracts approximates... -
Page 108
...long-term debt ...Total ...Unaccreted discount/issuance costs ...Hedge accounting fair value adjustments ...Total ...Reported as: Current portion of long-term debt ...Long-term debt ...Total ...(1) September 3, 2015 March 3, 2017 June 15, 2018 March 1, 2019 November 17, 2014 February 22, 2016 March... -
Page 109
... program, as discussed above under "(a) Short-Term Debt." As of July 25, 2015, the Company was in compliance with all debt covenants. As of July 25, 2015, future principal payments for long-term debt, including the current portion, are summarized as follows (in millions): Fiscal Year Amount 2016... -
Page 110
... 2015 2014 2013 GAINS (LOSSES) RELATED TO HEDGED ITEMS FOR THE YEARS ENDED July 25, July 26, July 27, 2015 2014 2013 Derivatives Designated as Fair Value Hedging Instruments Line Item in Statements of Operations Equity derivatives ...Interest rate derivatives ...Total ... Other income (loss), net... -
Page 111
...(LOSSES) FOR THE YEARS ENDED July 25, July 26, July 27, 2015 2014 2013 Derivatives Not Designated as Hedging Instruments Line Item in Statements of Operations Foreign currency derivatives ...Other income (loss), net Total return swaps-deferred compensation ...Operating expenses Equity derivatives... -
Page 112
...various dates from 2017 through 2025. In the periods prior to fiscal 2013, the Company entered into interest rate swaps designated as fair value hedges related to fixed-rate senior notes that are due in 2016 and 2017. Under these interest rate swaps, the Company receives fixed-rate interest payments... -
Page 113
...and $416 million in fiscal 2015, 2014, and 2013, respectively. (b) Purchase Commitments with Contract Manufacturers and Suppliers The Company purchases components from a variety of suppliers and uses several contract manufacturers to provide manufacturing services for its products. During the normal... -
Page 114
... Provision for warranties issued ...Payments ...Balance at end of fiscal year ...$ 446 $ 696 (693) 449 $ 402 $ 704 (660) 446 $ 373 649 (620) 402 The Company accrues for warranty costs as part of its cost of sales based on associated material product costs, labor costs for technical support staff... -
Page 115
... utilizing products provided by the Company and other manufacturers. Sprint seeks monetary damages. Sprint's cases in Kansas include claims against Comcast and Time Warner Cable, service provider customers of the Company. Although trial dates were originally set for the first half of calendar year... -
Page 116
...an obligation to indemnify its service provider customers for damages, mediation awards, or settlement amounts arising from their use of Cisco products. In addition, the Company has entered into indemnification agreements with its officers and directors, and the Company's Amended and Restated Bylaws... -
Page 117
... paid-in capital. Issuance of common stock and the tax benefit related to employee stock incentive plans are recorded as an increase to common stock and additional paid-in capital. (c) Restricted Stock Unit Withholdings For the years ended July 25, 2015 and July 26, 2014, the Company repurchased... -
Page 118
... may require subsequent service periods), with overall vesting of the shares underlying the award ranging from six months to three years. The Compensation and Management Development Committee of the Board of Directors has the discretion to use different vesting schedules. Stock appreciation rights... -
Page 119
...for stock options, stock purchase rights, restricted stock, and restricted stock units granted to employees. The following table summarizes share-based compensation expense (in millions): Years Ended July 25, 2015 July 26, 2014 July 27, 2013 Cost of sales-product ...$ Cost of sales-service ...Share... -
Page 120
... Restricted Stock and Stock Unit Awards A summary of the restricted stock and stock unit activity, which includes time-based and performance-based or market-based restricted stock units, is as follows (in millions, except per-share amounts): Restricted Stock/ Stock Units Weighted-Average Grant Date... -
Page 121
... exercise price was $26.50. (g) Valuation of Employee Share-Based Awards Time-based restricted stock units and PRSUs that are based on the Company's financial performance metrics or non-financial operating goals are valued using the market value of the Company's common stock on the date of grant... -
Page 122
... 2015, 2014, and 2013, respectively. The Plan allows employees who meet the age requirements and reach the Plan contribution limits to make catch-up contributions (pretax or Roth) not to exceed the lesser of 75% of their annual eligible earnings or the limit set forth in the Internal Revenue Code... -
Page 123
... item location, during each period were as follows (in millions): Comprehensive Income Components July 25, 2015 July 26, 2014 July 27, 2013 Income Before Taxes Line Item in Statements of Operations Net unrealized gains on available-for-sale investments $ Net unrealized gains and losses on cash flow... -
Page 124
... credit for calendar year 2014 R&D expenses. As a result, the tax provision in fiscal 2015 included a tax benefit of $138 million related to the U.S. R&D tax credit, of which $78 million was attributable to fiscal 2014. During fiscal 2013, the Internal Revenue Service (IRS) and the Company settled... -
Page 125
...tax benefits would affect the effective tax rate if realized. During fiscal 2015 the Company recognized $27 million of net interest expense and $3 million of penalties. During fiscal 2014, the Company recognized $29 million of net interest expense and $8 million of penalties. During fiscal 2013, the... -
Page 126
...): July 25, 2015 July 26, 2014 ASSETS Allowance for doubtful accounts and returns ...Sales-type and direct-financing leases ...Inventory write-downs and capitalization ...Investment provisions ...IPR&D, goodwill, and purchased intangible assets ...Deferred revenue ...Credits and net operating loss... -
Page 127
... for groups of similar products and services (in millions): Years Ended July 25, 2015 July 26, 2014 July 27, 2013 Revenue: Switching ...$ NGN Routing ...Collaboration ...Service Provider Video ...Data Center ...Wireless ...Security ...Other ...Product ...Service ...Total ...$ 119 14,741 7,704... -
Page 128
... average share price for each fiscal period using the treasury stock method. Under the treasury stock method, the amount the employee must pay for exercising stock options, the amount of compensation cost for future service that the Company has not yet recognized, and the amount of tax benefits that... -
Page 129
... in Securities and Exchange Commission rules and forms and is accumulated and communicated to our management, including our principal executive officer and principal financial officer, as appropriate to allow timely decisions regarding required disclosure. Internal Control over Financial Reporting... -
Page 130
...Statement related to the 2015 Annual Meeting of Shareholders and is incorporated herein by reference. We have adopted a code of ethics that applies to our principal executive officer and all members of our finance department, including the principal financial officer and principal accounting officer... -
Page 131
... report. SCHEDULE II VALUATION AND QUALIFYING ACCOUNTS (in millions) Allowances For Financing Accounts Receivables Receivable Year ended July 27, 2013: Balance at beginning of fiscal year ...Provisions ...(Write-offs) recoveries, net ...Foreign exchange and other ...Balance at end of fiscal year... -
Page 132
SIGNATURES Pursuant to the requirements of Section 13 or 15(d) of the Securities Exchange Act of 1934, the registrant has duly caused this Report on Form 10-K to be signed on its behalf by the undersigned, thereunto duly authorized. September 8, 2015 CISCO SYSTEMS, INC. /S/ CHARLES H. ROBBINS ... -
Page 133
Signature Title Date /S/ M. MICHELE BURNS M. Michele Burns /S/ MICHAEL D. CAPELLAS Michael...2015 Director September 8, 2015 Director September 8, 2015 Director September 8, 2015 Director September 8, 2015 Director September 8, 2015 Director September 8, 2015 Director September 8, 2015... -
Page 134
... Scientific-Atlanta) (including related form agreements) Cisco Systems, Inc. WebEx Acquisition Long-Term Incentive Plan. (amends and restates the WebEx Communications, Inc. Amended and Restated 2000 Stock Incentive Plan) (including related form agreements) Cisco Systems, Inc. Employee Stock Purchase... -
Page 135
... by and among Cisco Systems, Inc. and Lenders party thereto, and Bank of America, N.A., as administration agent, swing line lender and an L/C issuer Form of Commercial Paper Dealer Agreement Commercial Paper Issuing and Paying Agent Agreement dated January 31, 2011 between the Registrant and Bank of... -
Page 136
[THIS PAGE INTENTIONALLY LEFT BLANK] -
Page 137
... Services P.O. Box 43078 Providence, RI 02940-3078 Website: www-us.computershare.com/investor Toll Free: 800-254-5194 International: 781-575-2879 Independent Registered Public Accounting Firm PricewaterhouseCoopers LLP San Jose, California Notice of Annual Meeting Cisco Systems, Inc. Building... -
Page 138
...; our acquisition strategy of buy, build, partner and invest, and the degree to which that strategy will help us capitalize on market transitions and maintain leadership in our current business areas; increasing the percentage of software and subscriptionrelated revenue within our overall sales mix... -
Page 139
Annual Report 2015 Corporate Information Company Profile Cisco designs and sells broad lines of products, provides services and delivers integrated solutions to develop and connect networks around the world, building the Internet. Over the last 30 plus years, we have been the world's leader in ... -
Page 140
WORLDWIDE OFFICES Americas Headquarters San Jose, California, USA Asia Pacific Headquarters Singapore Europe Headquarters Amsterdam, Netherlands Cisco has more than 400 o ces worldwide. Addresses, phone numbers, and fax numbers are listed on the Cisco website at www.cisco.com/go/o ces.