Cisco 2008 Annual Report Download - page 78
Download and view the complete annual report
Please find page 78 of the 2008 Cisco annual report below. You can navigate through the pages in the report by either clicking on the pages listed below, or by using the keyword search tool below to find specific information within the annual report.-
 1
1 -
2
-
3
-
4
-
5
-
6
-
7
-
8
-
9
-
10
-
11
-
12
-
13
-
14
-
15
-
16
-
17
-
18
-
19
-
20
-
21
-
22
-
23
-
24
-
25
-
26
-
27
-
28
-
29
-
30
-
31
-
32
-
33
-
34
-
35
-
36
-
37
-
38
-
39
-
40
-
41
-
42
-
43
-
44
-
45
-
46
-
47
-
48
-
49
-
50
-
51
-
52
-
53
-
54
-
55
-
56
-
57
-
58
-
59
-
60
-
61
-
62
-
63
-
64
-
65
-
66
-
67
-
 68
68 -
 69
69 -
 70
70 -
 71
71 -
 72
72 -
 73
73 -
 74
74 -
 75
75 -
 76
76 -
 77
77 -
 78
78 -
 79
79 -
 80
80 -
 81
81
 |
 |

2008 Annual Report 83
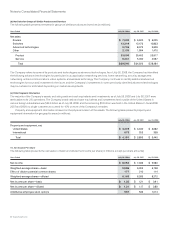
Supplementary Financial Data (Unaudited)
(in millions, except per-share amounts)
Quarters Ended July 26, 2008 Apr. 26, 2008 Jan. 26, 2008 Oct. 27, 2007 July 28, 2007 Apr. 28, 2007 Jan. 27, 2007 Oct. 28, 2006
Net sales $ 10,364 $ 9,791 $ 9,831 $ 9,554 $ 9,433 $ 8,866 $ 8,439 $ 8,184
Gross margin $ 6,666 $ 6,305 $ 6,340 $ 6,173 $ 6,068 $ 5,647 $ 5,388 $ 5,233
Net income $ 2,014 $ 1,773 $ 2,060 $ 2,205 $ 1,930 $ 1,874 $ 1,921 $ 1,608
Net income per share—basic $ 0.34 $ 0.30 $ 0.34 $ 0.36 $ 0.32 $ 0.31 $ 0.32 $ 0.27
Net income per share—diluted $ 0.33 $ 0.29 $ 0.33 $ 0.35 $ 0.31 $ 0.30 $ 0.31 $ 0.26
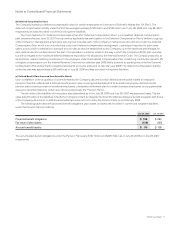
Cash and cash equivalents
and investments $ 26,235 $ 24,433 $ 22,693 $ 24,679 $ 22,266 $ 22,336 $ 20,681 $ 19,520
Stock Market Information
Cisco common stock is traded on the NASDAQ Global Select Market under the symbol CSCO. The following table lists the high and low
sales prices for each period indicated:
2008 2007
Fiscal High Low High Low
First quarter $ 33.60 $ 28.58 $ 24.78 $ 17.10
Second quarter $ 34.24 $ 22.30 $ 28.99 $ 23.27
Third quarter $ 26.29 $ 21.77 $ 28.85 $ 24.82
Fourth quarter $ 27.72 $ 20.56 $ 30.39 $ 25.33
The Company has never paid cash dividends on its common stock and has no present plans to do so. There were 68,705 registered
shareholders as of September 5, 2008.
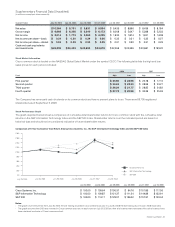
Stock Performance Graph
The graph depicted below shows a comparison of cumulative total shareholder returns for Cisco common stock with the cumulative total
returns on the S&P Information Technology Index and the S&P 500 Index. Shareholder returns over the indicated period are based on
historical data and should not be considered indicative of future shareholder returns.
Comparison of 5-Year Cumulative Total Return Among Cisco Systems, Inc., the S&P Information Technology Index and the S&P 500 Index
July 25, 2003 July 30, 2004 July 29, 2005 July 28, 2006 July 27, 2007 July 25, 2008
Cisco Systems, Inc. $ 100.00 $ 109.64 $ 100.37 $ 94.76 $ 151.83 $ 117.56
S&P Information Technology $ 100.00 $ 109.87 $ 121.37 $ 111.24 $ 144.89 $ 132.91
S&P 500 $ 100.00 $ 113.17 $ 129.07 $ 136.02 $ 157.97 $ 140.44
Notes:
• The graph covers the period from July 25, 2003, the last trading day before Cisco’s 2004 fiscal year, to July 25, 2008, the last trading day of Cisco’s 2008 fiscal year.
• The graph assumes that $100 was invested in Cisco common stock and in each index on July 25, 2003 and that all dividends were reinvested. No cash dividends have
been declared on shares of Cisco’s common stock.
July 25, 2003
$180
July 30, 2004 July 29, 2005 July 28, 2006 July 27, 2007 July 25, 2008
$160
$140
$120
$100
$80
$60
$40
$20
Cisco Systems, Inc.
S&P Information Technology
S&P 500
$0