Cisco 2008 Annual Report Download - page 22
Download and view the complete annual report
Please find page 22 of the 2008 Cisco annual report below. You can navigate through the pages in the report by either clicking on the pages listed below, or by using the keyword search tool below to find specific information within the annual report.-
 1
1 -
2
-
3
-
4
-
5
-
6
-
7
-
8
-
9
-
10
-
11
-
 12
12 -
 13
13 -
 14
14 -
 15
15 -
 16
16 -
 17
17 -
 18
18 -
 19
19 -
 20
20 -
 21
21 -
 22
22 -
 23
23 -
 24
24 -
 25
25 -
 26
26 -
 27
27 -
 28
28 -
 29
29 -
 30
30 -
 31
31 -
 32
32 -
33
-
34
-
35
-
36
-
37
-
38
-
39
-
40
-
41
-
42
-
43
-
44
-
45
-
46
-
47
-
48
-
49
-
50
-
51
-
52
-
53
-
54
-
55
-
56
-
57
-
58
-
59
-
60
-
61
-
62
-
63
-
64
-
65
-
66
-
67
-
68
-
69
-
70
-
71
-
72
-
73
-
74
-
75
-
76
-
77
-
78
-
79
-
80
-
81
 |
 |

2008 Annual Report 27
Management’s Discussion and Analysis of Financial Condition and Results of Operations
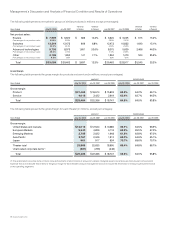
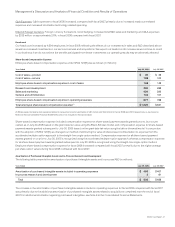
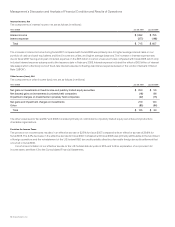
Research and Development, Sales and Marketing, and General and Administrative Expenses
Research and development (R&D), sales and marketing, and general and administrative (G&A) expenses are summarized in the following
table (in millions, except percentages):
Years Ended July 28, 2007
Variance
in Dollars
Variance
in Percent July 28, 2007 July 29, 2006
Variance
in Dollars
Variance
in PercentJuly 26, 2008
Research and development $ 5,153 $ 4,499 $ 654 14.5% $ 4,499 $ 4,067 $ 432 10.6%
Percentage of net sales 13.0% 12.9% 12.9% 14.3%
Sales and marketing 8,380 7,215 1,165 16.1% 7,215 6,031 1,184 19.6%
Percentage of net sales 21.2% 20.7% 20.7% 21.2%
General and administrative 2,007 1,513 494 32.7% 1,513 1,169 344 29.4%
Percentage of net sales 5.1% 4.3% 4.3% 4.1%
Total $ 15,540 $ 13,227 $ 2,313 17.5% $ 13,227 $ 11,267 $ 1,960 17.4%
Percentage of net sales 39.3% 37.9% 37.9% 39.6%
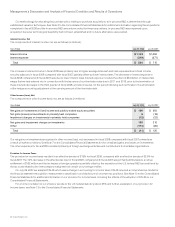
Interest and Other Income (Loss), Net
The following table presents the breakdown of interest and other income (loss), net (in millions):
Years Ended July 28, 2007
Variance
in Dollars July 28, 2007 July 29, 2006
Variance
in DollarsJuly 26, 2008
Interest income, net $ 824 $ 715 $ 109 $ 715 $ 607 $ 108
Other income (loss), net (11) 125 (136) 125 30 95
Total $ 813 $ 840 $ (27) $ 840 $ 637 $ 203
Discussion of Fiscal 2008 and 2007
The following discussion of fiscal 2008 compared with fiscal 2007 should be read in conjunction with the section of this report entitled
“Financial Data for Fiscal 2008, 2007, and 2006.”
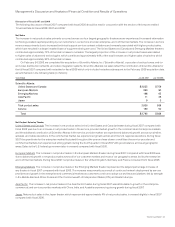
Net Sales
Net sales increased by 13% in fiscal 2008 compared with fiscal 2007. Revenue increased in each of our five geographic theaters and in each
of our customer markets in fiscal 2008 compared with fiscal 2007, as we benefited from increased information technology-related capital
spending in our markets. Our sales also benefited from our entry into new markets and the development of adjacent product offerings.
Net sales by theater in a particular period may be significantly impacted by several factors related to revenue recognition, including
the complexity of transactions such as multiple element arrangements; the mix of financings provided to our channel partners and
customers; and final acceptance of the product, system, or solution, among other factors. In addition, certain customers tend to make
large and sporadic purchases and the net sales related to these transactions may also be affected by the timing of revenue recognition.
Net Product Sales by Theater
United States and Canada Net product sales in the United States and Canada theater increased during fiscal 2008 compared with fiscal
2007; however, during the second half of fiscal 2008, we experienced slower growth in net product sales in this theater due to unfavorable
economic and market conditions and the associated impact on information technology spending. In particular, during the second half
of fiscal 2008, we experienced slower year-over-year growth in sales in the service provider market in the United States due to lower
spending by a few large customers, after having experienced higher year-over-year growth during the first six months of fiscal 2008. In the
enterprise market, our product sales were relatively flat in fiscal 2008 compared with fiscal 2007 despite increased sales to the U.S. federal
government. In the commercial market, we experienced an increase in net product sales in fiscal 2008 compared with fiscal 2007, due in
part to the contribution of sales from WebEx Communications, Inc. (“WebEx”), which we acquired during the fourth quarter of fiscal 2007.