Cisco 2008 Annual Report Download - page 20
Download and view the complete annual report
Please find page 20 of the 2008 Cisco annual report below. You can navigate through the pages in the report by either clicking on the pages listed below, or by using the keyword search tool below to find specific information within the annual report.-
 1
1 -
2
-
3
-
4
-
5
-
6
-
7
-
8
-
9
-
 10
10 -
 11
11 -
 12
12 -
 13
13 -
 14
14 -
 15
15 -
 16
16 -
 17
17 -
 18
18 -
 19
19 -
 20
20 -
 21
21 -
 22
22 -
 23
23 -
 24
24 -
 25
25 -
 26
26 -
 27
27 -
 28
28 -
 29
29 -
 30
30 -
31
-
32
-
33
-
34
-
35
-
36
-
37
-
38
-
39
-
40
-
41
-
42
-
43
-
44
-
45
-
46
-
47
-
48
-
49
-
50
-
51
-
52
-
53
-
54
-
55
-
56
-
57
-
58
-
59
-
60
-
61
-
62
-
63
-
64
-
65
-
66
-
67
-
68
-
69
-
70
-
71
-
72
-
73
-
74
-
75
-
76
-
77
-
78
-
79
-
80
-
81
 |
 |

2008 Annual Report 25
Management’s Discussion and Analysis of Financial Condition and Results of Operations
Financial Data for Fiscal 2008, 2007, and 2006
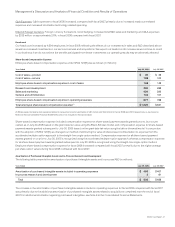
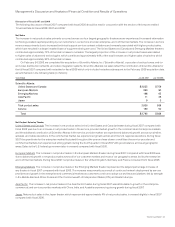
Net Sales
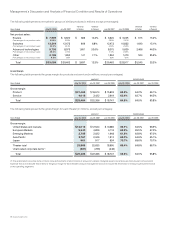
The following table presents the breakdown of net sales between product and service revenue (in millions, except percentages):
Years Ended July 28, 2007
Variance
in Dollars
Variance
in Percent July 28, 2007 July 29, 2006
Variance
in Dollars
Variance
in PercentJuly 26, 2008
Net sales:
Product $ 33,099 $ 29,462 $ 3,637 12.3% $ 29,462 $ 23,917 $ 5,545 23.2%
Percentage of net sales 83.7% 84.4% 84.4% 84.0%
Service 6,441 5,460 981 18.0% 5,460 4,567 893 19.6%
Percentage of net sales 16.3% 15.6% 15.6% 16.0%
Total $ 39,540 $ 34,922 $ 4,618 13.2% $ 34,922 $ 28,484 $ 6,438 22.6%
During the first quarter of fiscal 2008, we enhanced our methodology for attributing certain revenue transactions, including revenue
deferrals, and the associated cost of sales for each, to the respective geographic theater. As a result, we have reclassified fiscal 2007
and 2006 net sales by theater, net product sales by theater, and gross margin by theater to conform to the current year’s presentation.
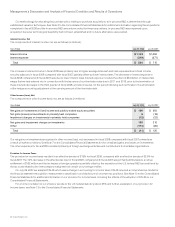
Net sales, which include product and service revenue, for each theater are summarized in the following table (in millions, except percentages):
Years Ended July 28, 2007
Variance
in Dollars
Variance
in Percent July 28, 2007 July 29, 2006
Variance
in Dollars
Variance
in PercentJuly 26, 2008
Net sales:
United States and Canada $ 21,314 $ 19,380 $ 1,934 10.0% $ 19,380 $ 15,623 $ 3,757 24.0%
Percentage of net sales 53.9% 55.5% 55.5% 54.9%
European Markets 8,103 7,371 732 9.9% 7,371 6,145 1,226 20.0%
Percentage of net sales 20.5% 21.1% 21.1% 21.6%
Emerging Markets 4,510 3,221 1,289 40.0% 3,221 2,460 761 30.9%
Percentage of net sales 11.4% 9.2% 9.2% 8.6%
Asia Pacific 4,254 3,632 622 17.1% 3,632 2,935 697 23.7%
Percentage of net sales 10.8% 10.4% 10.4% 10.3%
Japan 1,359 1,318 41 3.1% 1,318 1,321 (3) (0.2)%
Percentage of net sales 3.4% 3.8% 3.8% 4.6%
Total $ 39,540 $ 34,922 $ 4,618 13.2% $ 34,922 $ 28,484 $ 6,438 22.6%
Net Product Sales
The following table presents the breakdown of net product sales by theater (in millions, except percentages):
Years Ended July 28, 2007
Variance
in Dollars
Variance
in Percent July 28, 2007 July 29, 2006
Variance
in Dollars
Variance
in PercentJuly 26, 2008
Net product sales:
United States and Canada $ 16,965 $ 15,579 $ 1,386 8.9% $ 15,579 $ 12,439 $ 3,140 25.2%
Percentage of net product sales 51.2% 52.9% 52.9% 52.0%
European Markets 7,072 6,542 530 8.1% 6,542 5,405 1,137 21.0%
Percentage of net product sales 21.4% 22.2% 22.2% 22.6%
Emerging Markets 4,083 2,925 1,158 39.6% 2,925 2,280 645 28.3%
Percentage of net product sales 12.3% 9.9% 9.9% 9.5%
Asia Pacific 3,803 3,250 553 17.0% 3,250 2,632 618 23.5%
Percentage of net product sales 11.5% 11.0% 11.0% 11.0%
Japan 1,176 1,166 10 0.9% 1,166 1,161 5 0.4%
Percentage of net product sales 3.6% 4.0% 4.0% 4.9%
Total $ 33,099 $ 29,462 $ 3,637 12.3% $ 29,462 $ 23,917 $ 5,545 23.2%