Cisco 2008 Annual Report Download - page 34
Download and view the complete annual report
Please find page 34 of the 2008 Cisco annual report below. You can navigate through the pages in the report by either clicking on the pages listed below, or by using the keyword search tool below to find specific information within the annual report.-
 1
1 -
2
-
3
-
4
-
5
-
6
-
7
-
8
-
9
-
10
-
11
-
12
-
13
-
14
-
15
-
16
-
17
-
18
-
19
-
20
-
21
-
22
-
23
-
 24
24 -
 25
25 -
 26
26 -
 27
27 -
 28
28 -
 29
29 -
 30
30 -
 31
31 -
 32
32 -
 33
33 -
 34
34 -
 35
35 -
 36
36 -
 37
37 -
 38
38 -
 39
39 -
 40
40 -
 41
41 -
 42
42 -
 43
43 -
 44
44 -
45
-
46
-
47
-
48
-
49
-
50
-
51
-
52
-
53
-
54
-
55
-
56
-
57
-
58
-
59
-
60
-
61
-
62
-
63
-
64
-
65
-
66
-
67
-
68
-
69
-
70
-
71
-
72
-
73
-
74
-
75
-
76
-
77
-
78
-
79
-
80
-
81
 |
 |
2008 Annual Report 39
Management’s Discussion and Analysis of Financial Condition and Results of Operations
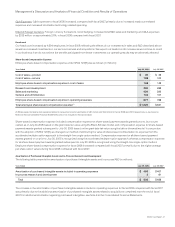
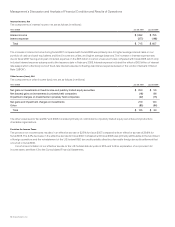
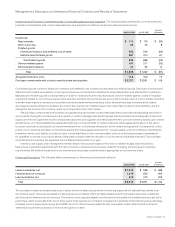
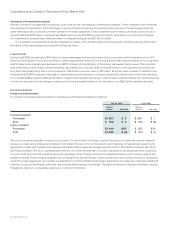
Inventories and Purchase Commitments with Contract Manufacturers and Suppliers The following table summarizes our inventories and
purchase commitments with contract manufacturers and suppliers (in millions, except annualized inventory turns):
July 28, 2007
Increase
(Decrease)July 26, 2008
Inventories:
Raw materials $ 111 $ 173 $ (62)
Work in process 53 45 8
Finished goods:
Distributor inventory and deferred cost of sales 452 544 (92)
Manufactured finished goods 381 314 67
Total finished goods 833 858 (25)
Service-related spares 191 211 (20)
Demonstration systems 47 35 12
Total $ 1,235 $ 1,322 $ (87)
Annualized inventory turns 11.8 10.3 1.5
Purchase commitments with contract manufacturers and suppliers $ 2,727 $ 2,581 $ 146
Our finished goods consist of distributor inventory and deferred cost of sales and manufactured finished goods. Distributor inventory and
deferred cost of sales are related to unrecognized revenue on shipments to distributors and retail partners and shipments to customers.
Manufactured finished goods consist primarily of build-to-order and build-to-stock products. Service-related spares consist of reusable
equipment related to our technical support and warranty activities. All inventories are accounted for at the lower of cost or market. Inventory
is written down based on excess and obsolete inventories determined primarily by future demand forecasts. Inventory write-downs
are measured as the difference between the cost of the inventory and market, based upon assumptions about future demand, and are
charged to the provision for inventory, which is a component of our cost of sales.
We purchase components from a variety of suppliers and use several contract manufacturers to provide manufacturing services for
our products. During the normal course of business, in order to manage manufacturing lead times and help ensure adequate component
supply, we enter into agreements with contract manufacturers and suppliers that either allow them to procure inventory based upon criteria
as defined by us or that establish the parameters defining our requirements. In certain instances, these agreements allow us the option
to cancel, reschedule, and adjust our requirements based on our business needs prior to firm orders being placed. Consequently, only a
portion of our reported purchase commitments arising from these agreements are firm, noncancelable, and unconditional commitments.
In addition, we record a liability, included in other current liabilities, for firm, noncancelable, and unconditional purchase commitments
for quantities in excess of our future demand forecasts consistent with the valuation of our excess and obsolete inventory. The purchase
commitments for inventory are expected to be fulfilled primarily within one year.
Inventory and supply chain management remain areas of focus as we balance the need to maintain supply chain flexibility to
help ensure competitive lead times with the risk of inventory obsolescence because of rapidly changing technology and customer
requirements. We believe the amount of our inventory and purchase commitments is appropriate for our revenue levels.
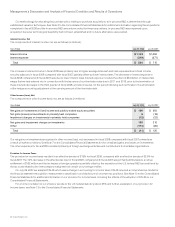
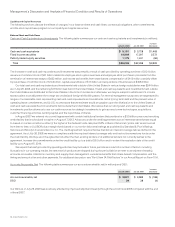
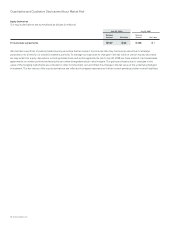
Financing Receivables The following table summarizes our financing receivables (in millions):
July 28, 2007
Increase
(Decrease)July 26, 2008
Lease receivables, net $ 1,416 $ 928 $ 488
Financed service contracts 1,318 853 465
Loan receivables, net 479 270 209
Total $ 3,213 $ 2,051 $ 1,162
The increase in lease receivables was due to higher volume of sales-type and direct financing leases, which typically have terms from
two to three years. The revenue related to financed service contracts, which primarily relates to technical support services, is deferred
and included in deferred service revenue. The revenue is recognized ratably over the period during which the related services are to be
performed, which is typically from one to three years. Financed service contracts increased due primarily to the financing of several large
multiyear service agreements during fiscal 2008. A portion of the revenue related to loan receivables is also deferred and included in
deferred product revenue based on revenue recognition criteria.