Cisco 2008 Annual Report Download - page 15
Download and view the complete annual report
Please find page 15 of the 2008 Cisco annual report below. You can navigate through the pages in the report by either clicking on the pages listed below, or by using the keyword search tool below to find specific information within the annual report.-
 1
1 -
2
-
3
-
4
-
 5
5 -
 6
6 -
 7
7 -
 8
8 -
 9
9 -
 10
10 -
 11
11 -
 12
12 -
 13
13 -
 14
14 -
 15
15 -
 16
16 -
 17
17 -
 18
18 -
 19
19 -
 20
20 -
 21
21 -
 22
22 -
 23
23 -
 24
24 -
 25
25 -
26
-
27
-
28
-
29
-
30
-
31
-
32
-
33
-
34
-
35
-
36
-
37
-
38
-
39
-
40
-
41
-
42
-
43
-
44
-
45
-
46
-
47
-
48
-
49
-
50
-
51
-
52
-
53
-
54
-
55
-
56
-
57
-
58
-
59
-
60
-
61
-
62
-
63
-
64
-
65
-
66
-
67
-
68
-
69
-
70
-
71
-
72
-
73
-
74
-
75
-
76
-
77
-
78
-
79
-
80
-
81
 |
 |
20 Cisco Systems, Inc.
Management’s Discussion and Analysis of Financial Condition and Results of Operations
As we have exited fiscal 2008, we continue to see uncertain market conditions, primarily in the United States. While it is difficult to
predict, we believe it is possible that these uncertain market conditions we see in the United States may spread to our other geographies.
In addition, we have seen a slowdown in capital expenditures by a few of our service provider customers and believe there may be potential
for a broader slowdown in the global service provider market in the next few quarters. Should these conditions persist or spread or such
capital expenditures decline, our operating results could be adversely affected. However, we believe that our strategy and our ability
to innovate and execute may enable us to improve our relative competitive position in difficult business conditions, and may continue to
provide us with long-term growth opportunities. As we have done in the past, we will attempt to use the current market uncertainty as an
opportunity to expand our share of our customers’ information technology spending and to continue moving into product adjacencies.
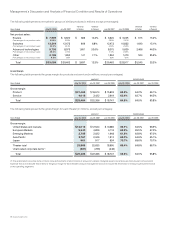
Revenue
Net sales increased by 13% in fiscal 2008 compared with fiscal 2007. Revenue increased compared with fiscal 2007 in each of our five
geographic theaters and in each of our customer markets. During the second half of fiscal 2008, we experienced slower year-over-year
growth in sales to the service provider market in the United States. Sales to the enterprise market in the United States were relatively flat in
fiscal 2008 compared with fiscal 2007. Revenue for the Emerging Markets theater increased significantly during fiscal 2008 compared with
fiscal 2007, due to higher shipments and recognition of previously deferred revenue. Revenue for the Asia Pacific theater increased in fiscal
2008 as our customers in this theater, particularly in China and India, continued to invest in communications and information technology.
Revenue also increased in the European Markets and Japan theaters during fiscal 2008.
The increase in our revenue in fiscal 2008 also reflected balance across our products and services. The largest proportion of the
increase in net product sales in fiscal 2008 was in sales of advanced technologies. Sales of our advanced technologies, which represented
a larger proportion of our net product sales than routing, increased by 21% in fiscal 2008, due primarily to strength in sales of our unified
communications and video systems products. The increase in our sales of advanced technologies reflects our balanced product portfolio
and our efforts to constantly innovate and evolve into new markets and product adjacencies. In fiscal 2008, we also experienced strength
in sales of our routing products, led by our high-end routers. The increase in switching revenue in fiscal 2008 was led by higher sales of our
fixed-configuration switches.
We have focused on expanding our service model. In fiscal 2008, our net service revenue increased by approximately 18% compared
with fiscal 2007. Our service and support strategy seeks to capitalize on increased globalization, and we believe this strategy, along with our
architectural approach, has the potential to further differentiate us from competitors.
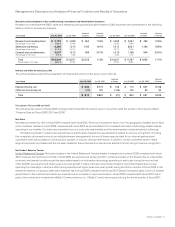
Operating Margin
In fiscal 2008, our gross margin percentage increased compared with fiscal 2007. The increase was driven by higher product gross margin,
which was due to lower manufacturing costs and higher shipment volume, partially offset by higher sales discounts, rebates, and product
pricing. Operating expenses in fiscal 2008 increased in both absolute dollars and as a percentage of revenue compared with fiscal 2007,
primarily as a result of increased headcount-related expenses. The effects of unfavorable foreign currency exchange rates also increased
operating expenses. Our headcount increased in fiscal 2008, reflecting investments in sales as well as research and development (R&D),
investments in our service business, and the effect of acquisitions.
Other Financial Highlights
The following is a summary of our other financial highlights for fiscal 2008:
• Our backlog at the end of fiscal 2008 was $4.8 billion, compared with $3.9 billion at the end of fiscal 2007.
• Our deferred revenue at the end of fiscal 2008 was $8.9 billion, compared with $7.0 billion at the end of fiscal 2007.
• We generated cash flows from operations of $12.1 billion. Our cash and cash equivalents, together with our investments, were
$26.2 billion at the end of fiscal 2008, compared with $22.3 billion at the end of fiscal 2007.
• We repurchased 372 million shares of our common stock for $10.4 billion during fiscal 2008.
• Days sales outstanding in accounts receivable (DSO) at the end of fiscal 2008 was 34 days, compared with 38 days at the end of
fiscal 2007.
• Our inventory balance was $1.2 billion at the end of fiscal 2008, compared with $1.3 billion at the end of fiscal 2007. Annualized inventory
turns were 11.8 in the fourth quarter of fiscal 2008, compared with 10.3 in the fourth quarter of fiscal 2007. Our purchase commitments
with contract manufacturers and suppliers were $2.7 billion at the end of fiscal 2008, compared with $2.6 billion at the end of fiscal 2007.